Visual tracking of critical U.S. elections with color-coded highlighting to enhance understanding of political events and their potential market implications.
Explore complementary indicator rolesHow it works
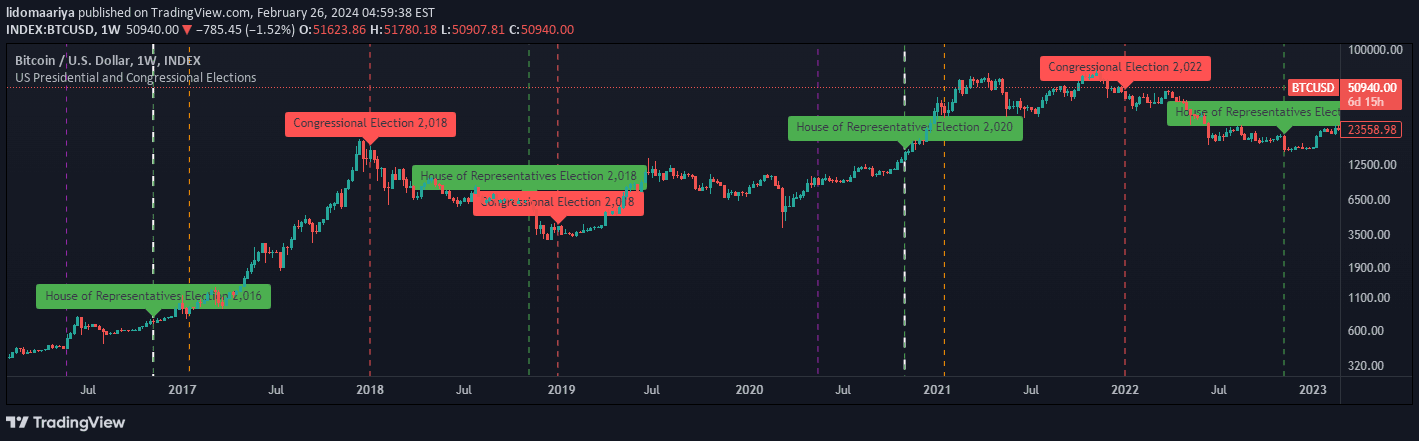
The election visualization system employs color-coded lines and labels to represent different types of U.S. elections and their significance. Purple lines are used to highlight the hawing, while white lines specifically mark presidential elections, showing their prominence in the political landscape.
Green labels are assigned to House of Representatives elections, and red labels are used for Senate congressional elections. This color-coded approach provides a quick and intuitive way to distinguish between various electoral events and their respective importance in the U.S. political system.
Why it may be useful
Political elections can significantly impact financial markets, investor sentiment, and economic policies. By visually tracking these events with distinct color coding, traders and analysts can quickly identify potential market-moving political developments.
The differentiation between presidential, congressional, and representative elections helps stakeholders understand the potential scope and intensity of political changes. This visualization method allows for rapid comprehension of electoral dynamics, enabling faster strategic decision-making and providing context for potential market reactions to political shifts.
When to explore it
This election tracking method is most useful during election cycles and periods of significant political transition. It provides a clear visual representation of electoral events that could influence market sentiment and economic policies. Investors and analysts can use this approach to quickly assess the potential impact of different types of elections.
The color-coded system is particularly valuable during national election years, when multiple levels of political contests are occurring simultaneously. It helps stakeholders maintain a comprehensive view of the political landscape and potential market implications.
Keep exploring
What we’ve verified
Access, alerts and repainting behaviour have not been independently verified for this indicator. Check the creator’s current publication and settings.
General descriptions and classifications are recovered research. Verified details above identify the specific checks we have completed. Check the creator’s current publication for later changes.