
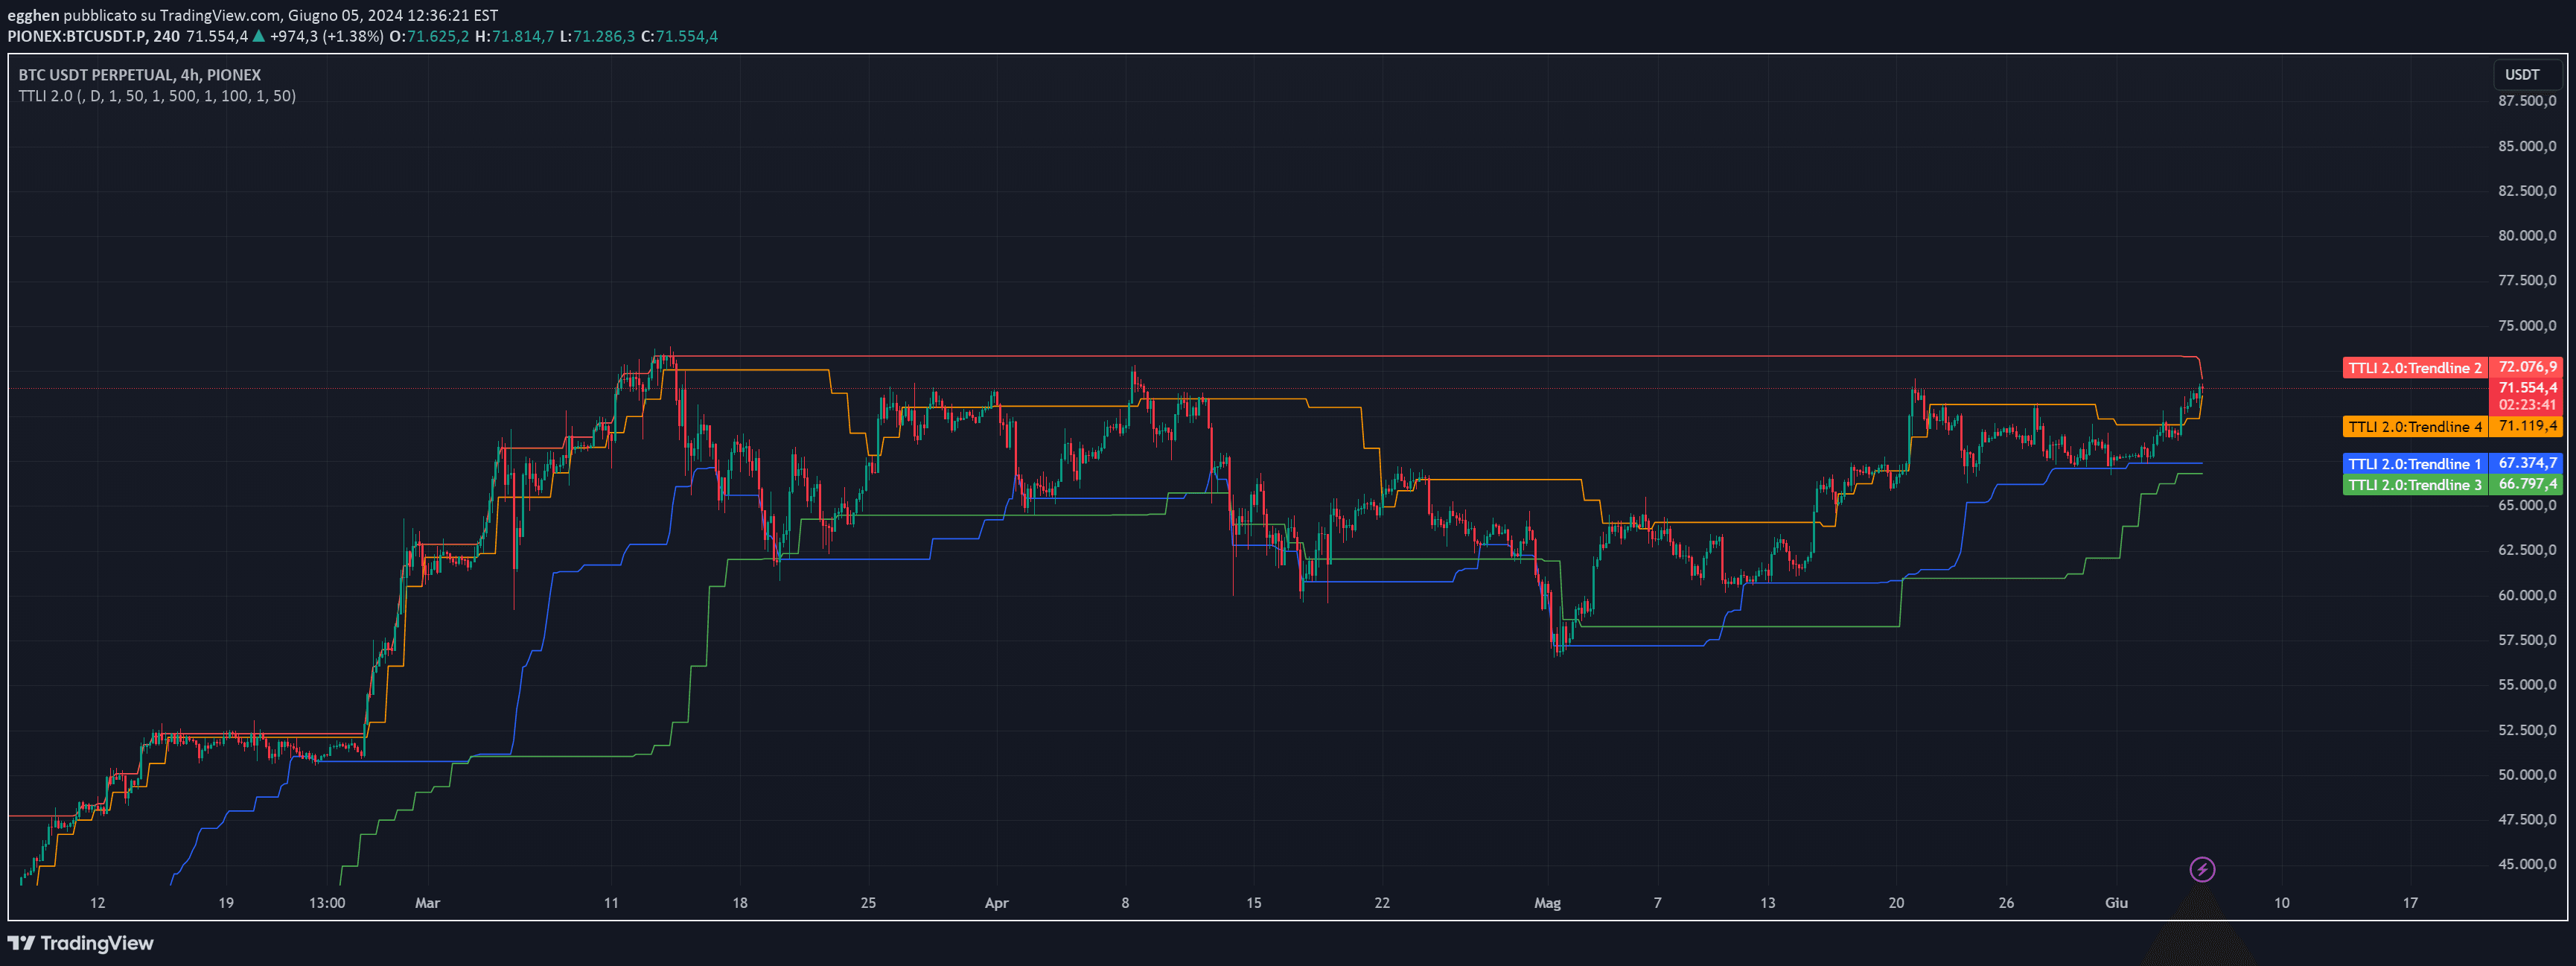
A trading indicator using four customizable trendlines to identify potential overbought and oversold market conditions, allowing traders to set personalized alerts and visualize price movements.
Explore complementary indicator rolesHow it works
The indicator calculates four dynamic trendlines based on user-defined parameters such as length, color, and width. Each trendline is plotted on the price chart, creating visual reference points that help traders identify potential price extremes and market conditions.
By analyzing the highest and lowest price levels within a specified range, the script generates trendlines that can highlight potential overbought or oversold scenarios. Traders can customize these trendlines to match their specific trading strategy, enabling more personalized market analysis.
Why it may be useful
This indicator provides traders with a flexible tool to identify potential market turning points and assess price momentum across different timeframes. By visualizing custom trendlines, traders can quickly recognize areas of potential price reversal or continued trend, enhancing their decision-making process.
The ability to set personalized alerts for trendline breaches allows traders to proactively monitor market movements without constantly watching the chart. This feature helps traders capture potential trading opportunities and manage risk more effectively.
When to explore it
The indicator works best in markets with clear trending or ranging characteristics, where price tends to respect dynamic support and resistance levels. Traders can utilize this tool across various financial instruments and timeframes, making it versatile for different trading styles and market conditions.
It is particularly useful during periods of market volatility, where identifying potential overbought or oversold conditions can provide valuable insights. Traders should combine this indicator with other technical analysis tools to confirm signals and improve overall trading accuracy.
Keep exploring
What we’ve verified
Access, alerts and repainting behaviour have not been independently verified for this indicator. Check the creator’s current publication and settings.
General descriptions and classifications are recovered research. Verified details above identify the specific checks we have completed. Check the creator’s current publication for later changes.


