
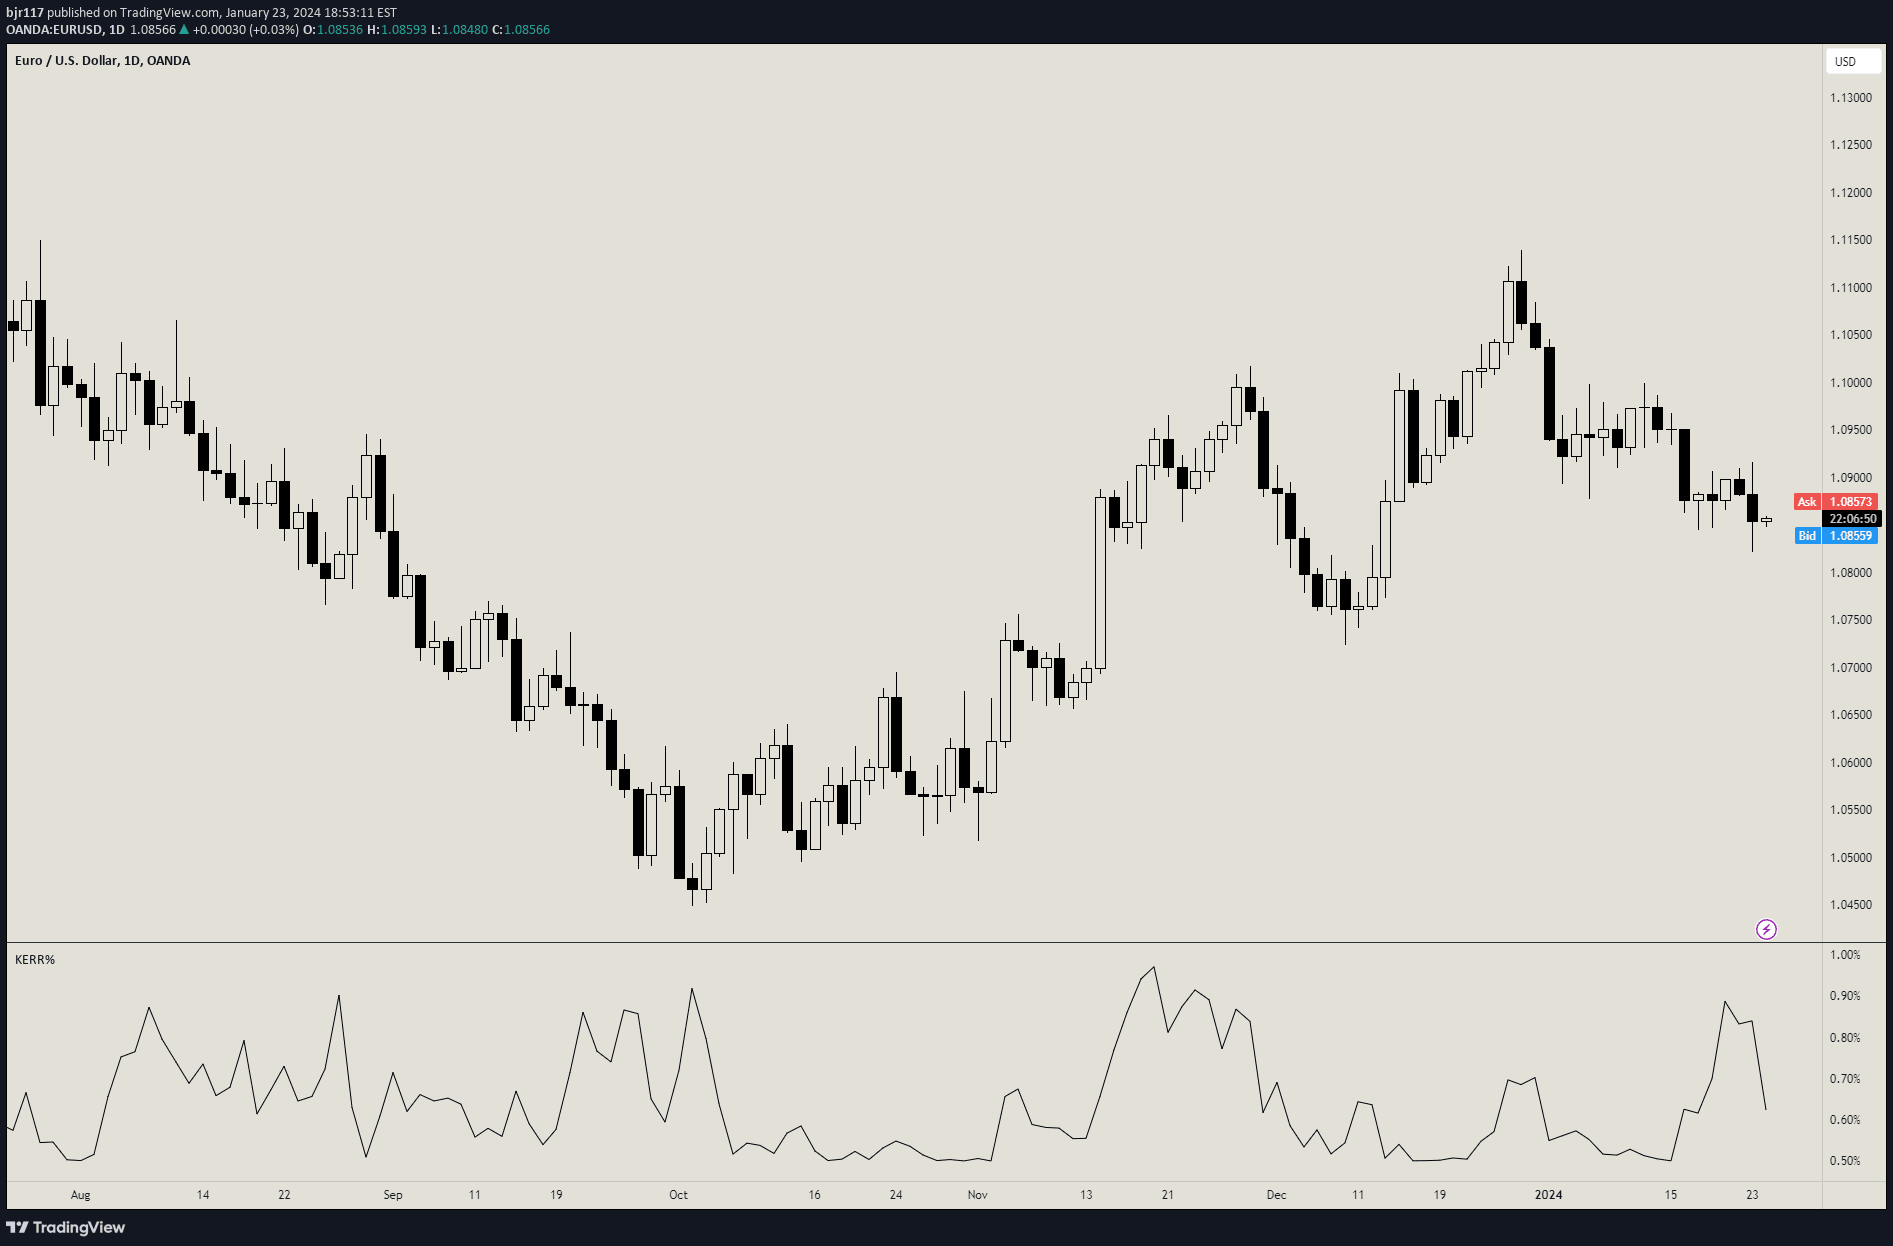
The Kaufman Efficiency Ratio-Based Exposure Management indicator helps traders adjust trade risk based on market efficiency, scaling risk percentage according to trending or ranging market conditions.
Explore complementary indicator rolesHow it works
The Kaufman Efficiency Ratio (KER) calculates market efficiency by comparing price change to total price movement over a specified number of bars. It measures the relationship between directional price movement and total price volatility, determining whether a market is trending or ranging.
By comparing the net price change against the sum of absolute price changes, the indicator generates a value between 0 and 1. Higher KER values suggest a trending market, while lower values indicate a choppy or ranging market, allowing traders to dynamically adjust their risk management strategy.
Why it may be useful
The Kaufman Efficiency Ratio helps traders adapt their risk management approach based on current market conditions, providing a systematic method to increase or decrease position sizing. By scaling risk percentage according to market efficiency, traders can potentially optimize their trading strategy and protect capital during less predictable market periods.
This approach allows traders to be more aggressive during trending markets and more conservative during ranging markets, helping to balance potential returns with risk mitigation. The indicator provides a quantitative method to adjust trading behavior based on objective market measurements.
When to explore it
The Kaufman Efficiency Ratio-Based Exposure Management indicator works best in markets with clear directional movements and identifiable trend characteristics. Traders should apply this method when seeking to dynamically adjust risk based on market efficiency across different timeframes and asset classes.
It is particularly useful for trend-following strategies, where identifying and capitalizing on sustained price movements is crucial. Traders should combine this indicator with other technical analysis tools to confirm market conditions and validate risk adjustment decisions.
Keep exploring
What we’ve verified
Access, alerts and repainting behaviour have not been independently verified for this indicator. Check the creator’s current publication and settings.
General descriptions and classifications are recovered research. Verified details above identify the specific checks we have completed. Check the creator’s current publication for later changes.



