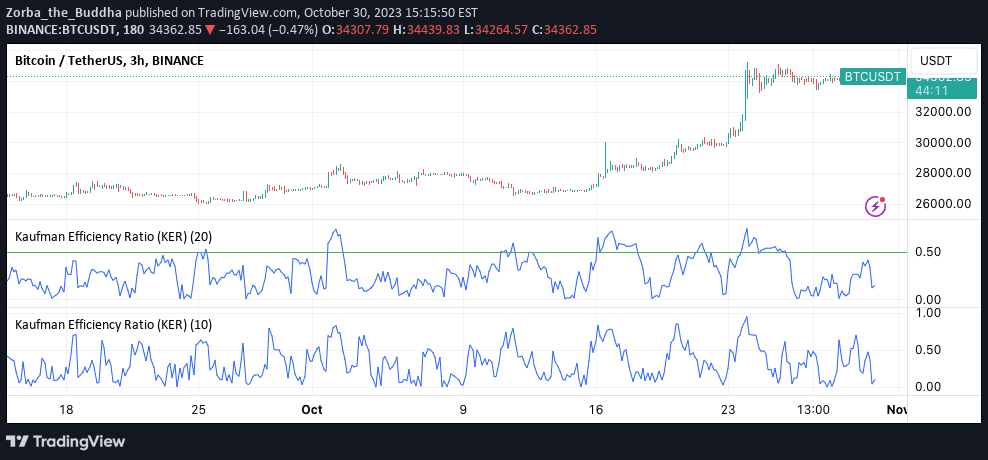
The Kaufman Efficiency Ratio measures the trending efficiency of price movements, quantifying market trendiness by comparing net price change to total price fluctuations.
Explore complementary indicator rolesHow it works
The Kaufman Efficiency Ratio calculates the relationship between price change and price volatility over a specified number of periods. It compares the net price movement to the total absolute price changes during that timeframe, creating a ratio that ranges from 0 to 1.
When the ratio approaches 1, it indicates a strong, efficient trend where prices are moving consistently in one direction. Conversely, a ratio closer to 0 suggests a choppy, range-bound market with frequent price reversals and less directional movement.
Why it may be useful
The Kaufman Efficiency Ratio provides traders with a quantitative method to assess market trending characteristics, helping them distinguish between trending and non-trending market conditions. By measuring price movement efficiency, traders can make more informed decisions about potential trade entry and exit points.
This indicator helps traders adapt their strategies based on market conditions, allowing them to identify when a market is more likely to produce consistent directional moves or when it might be more challenging to generate profitable trades.
When to explore it
The Kaufman Efficiency Ratio is most effective when used in conjunction with other technical analysis tools to confirm market trends and potential trading opportunities. It works particularly well in markets with clear directional movements, such as during strong bullish or bearish trends in stocks, commodities, or currencies.
Traders should be cautious when using this indicator in highly volatile or unpredictable markets, where price movements might not follow consistent patterns. Combining the Efficiency Ratio with momentum indicators and trend-following strategies can provide more comprehensive market insights.
Keep exploring
What we’ve verified
Access, alerts and repainting behaviour have not been independently verified for this indicator. Check the creator’s current publication and settings.
General descriptions and classifications are recovered research. Verified details above identify the specific checks we have completed. Check the creator’s current publication for later changes.