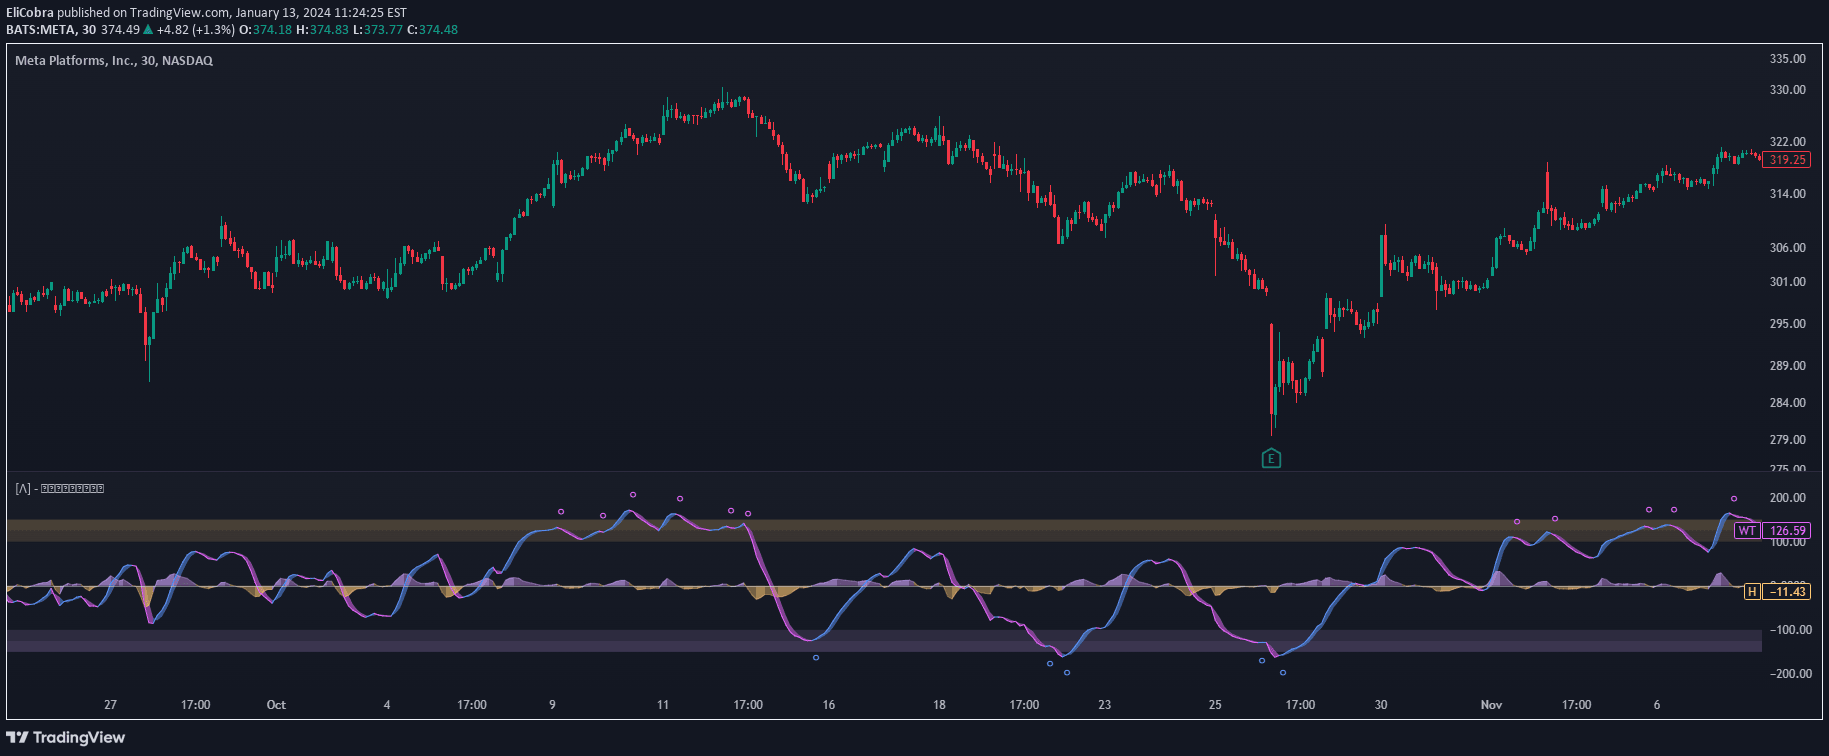
The Laguerre Stochastic is a modified stochastic oscillator using Laguerre transform for smoother price analysis, helping traders identify trend strength and potential reversals.
Explore complementary indicator rolesHow it works
The Laguerre Stochastic begins by calculating a standard stochastic oscillator, which measures the relationship between closing prices and their price range over a specific period. It then applies the Laguerre mathematical transform, which smooths the oscillator's values, reducing noise and creating a more refined indicator.
The process involves first computing the regular stochastic value by comparing the closing price to its recent high-low range. After this initial calculation, the Laguerre transform is applied to further smooth the data, creating a more stable and responsive indicator that can provide clearer signals about market momentum and potential trend changes.
Why it may be useful
The Laguerre Stochastic offers traders a more sophisticated approach to momentum analysis by reducing market noise and providing clearer trend signals. By smoothing price data using advanced mathematical techniques, it helps traders identify subtle shifts in market sentiment that might be missed by traditional stochastic indicators.
This refined oscillator allows traders to make more informed decisions by highlighting potential trend reversals and momentum shifts with greater precision. Its ability to filter out market noise makes it particularly valuable in volatile or choppy market conditions, where standard indicators might generate misleading signals.
When to explore it
The Laguerre Stochastic is most effective in markets with clear trending characteristics, where momentum shifts are significant and potentially tradable. It works best when used in conjunction with other technical analysis tools, providing confirmation of potential entry and exit points across various timeframes.
Traders should pay special attention to its signals when the indicator crosses above or below key reference lines, such as the middle, upper, and lower boundaries. These crossovers can indicate potential trend reversals, weakening momentum, or emerging trading opportunities in both bullish and bearish market conditions.
Keep exploring
What we’ve verified
Access, alerts and repainting behaviour have not been independently verified for this indicator. Check the creator’s current publication and settings.
General descriptions and classifications are recovered research. Verified details above identify the specific checks we have completed. Check the creator’s current publication for later changes.