
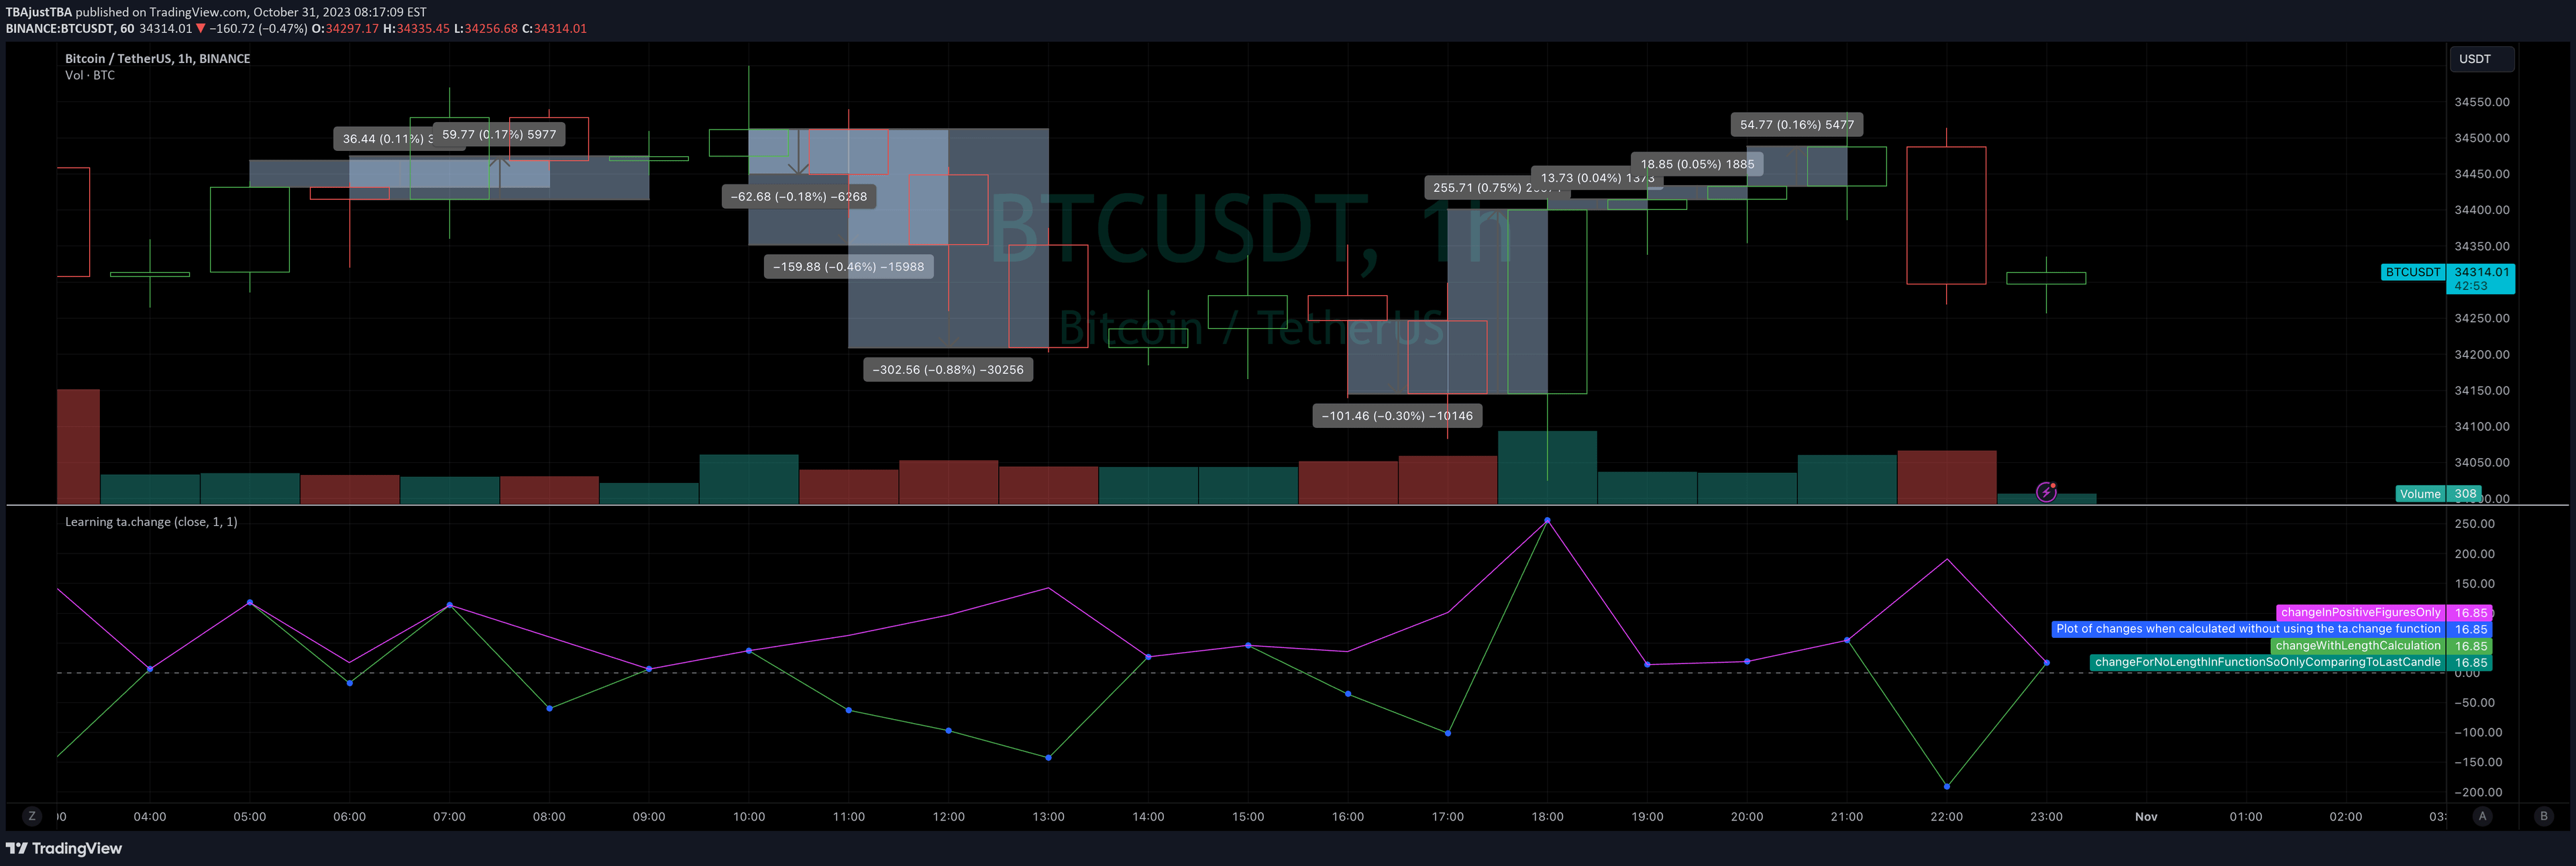
A technical analysis function that calculates price changes between consecutive periods, helping traders understand market movement dynamics and identify potential trend shifts.
Explore complementary indicator rolesHow it works
The price change function is a basic technical analysis tool that measures the absolute difference between current and previous price values in a financial instrument. It compares consecutive price points to determine the magnitude of price movement, which can be calculated across different time intervals and for various financial assets.
By tracking these incremental changes, traders can observe the raw price momentum and detect potential trend shifts. The function provides a straightforward numerical representation of price volatility, allowing quick assessment of market behavior without complex mathematical transformations.
Why it may be useful
Price change calculations are crucial for understanding market dynamics and identifying potential trading opportunities. They provide traders with a simple yet powerful metric to gauge price movement, helping to assess market sentiment and momentum across different timeframes and financial instruments.
By revealing the directional and quantitative aspects of price movement, these calculations enable traders to make more informed decisions about market entry and exit points. They serve as a foundational tool for developing more complex trading strategies and understanding underlying market trends.
When to explore it
Price change calculations are most effective during periods of consistent market trends and when analyzing shorter-term price movements. They work best in markets with clear directional momentum, such as during strong bullish or bearish trends across various financial instruments.
Traders should use price change analysis in conjunction with other technical indicators to confirm signals and reduce false positives. They are particularly useful in volatile markets where understanding rapid price fluctuations can provide critical insights into potential trading opportunities.
Keep exploring
What we’ve verified
Access, alerts and repainting behaviour have not been independently verified for this indicator. Check the creator’s current publication and settings.
General descriptions and classifications are recovered research. Verified details above identify the specific checks we have completed. Check the creator’s current publication for later changes.


