Hull Suite
Hull Moving Average (HMA) is an advanced technical indicator designed to minimize lag and provide smooth trend visualization across multiple variants with customizable settings.
Explore 11,183 indicators. Filter beyond the obvious.
Discover the tools that fit the way you trade.
11,183 tools to explore
Hull Moving Average (HMA) is an advanced technical indicator designed to minimize lag and provide smooth trend visualization across multiple variants with customizable settings.
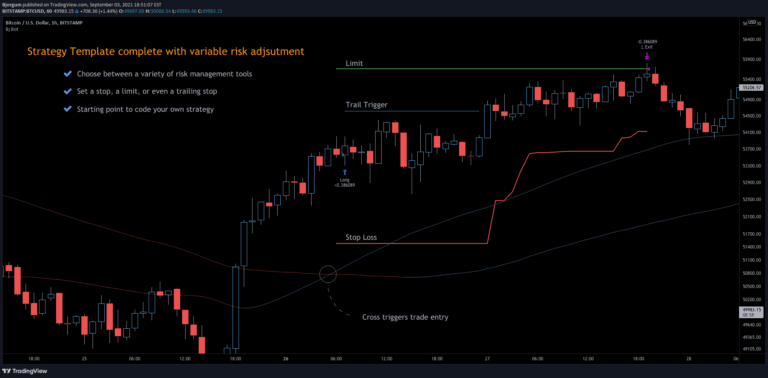
A 3Commas TradingView bot strategy offering automated trading with risk management, using moving average crossovers and customizable stop-loss and limit order settings.
A trading indicator designed to identify market liquidity zones and potential reversal areas by analyzing candle structures, wick-to-body ratios, and market sentiment shifts.
A market analysis tool that identifies market structure, grid levels, and volume distribution to help traders visualize trading activity and measure price movements across different ranges.
A non-linear regression indicator analyzing multiple price variables to generate trading signals using machine learning techniques and gradient descent optimization.
An advanced trading indicator that detects Fair Value Gaps (FVGs) and Swing Highs/Lows to help traders identify key market structures and potential trading opportunities across multiple markets and timeframes.
A trading strategy implementing dynamic trailing stop-loss and target mechanisms using percentage or fixed point-based calculations to manage trade entries and exits.
A comprehensive TradingView indicator that identifies Fair Value Gaps, Swing Highs/Lows, and previous Day/Week/Month High/Low levels to enhance trading decision-making.
A scalping indicator using multiple candlestick patterns to identify high-probability trading opportunities across different timeframes with minimal indicator reliance.
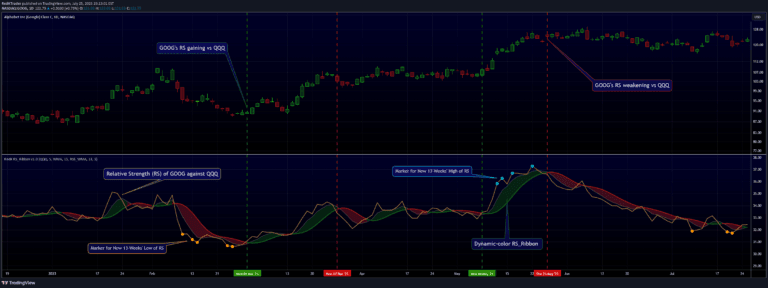
A technical analysis tool that compares a stock's performance against a benchmark index, revealing relative strength and potential market leadership through comprehensive RS calculation and visualization.
Williams Percent Range indicator with trendlines to identify market trends, overbought/oversold conditions, and potential breakouts across different trading timeframes.
A comprehensive trading dashboard that aggregates critical company information, fundamental data, price metrics, and analyst ratings into a single, easy-to-view analytical tool.
Likes, views, and comments are historical TradingView snapshots. They describe attention, not trading performance.