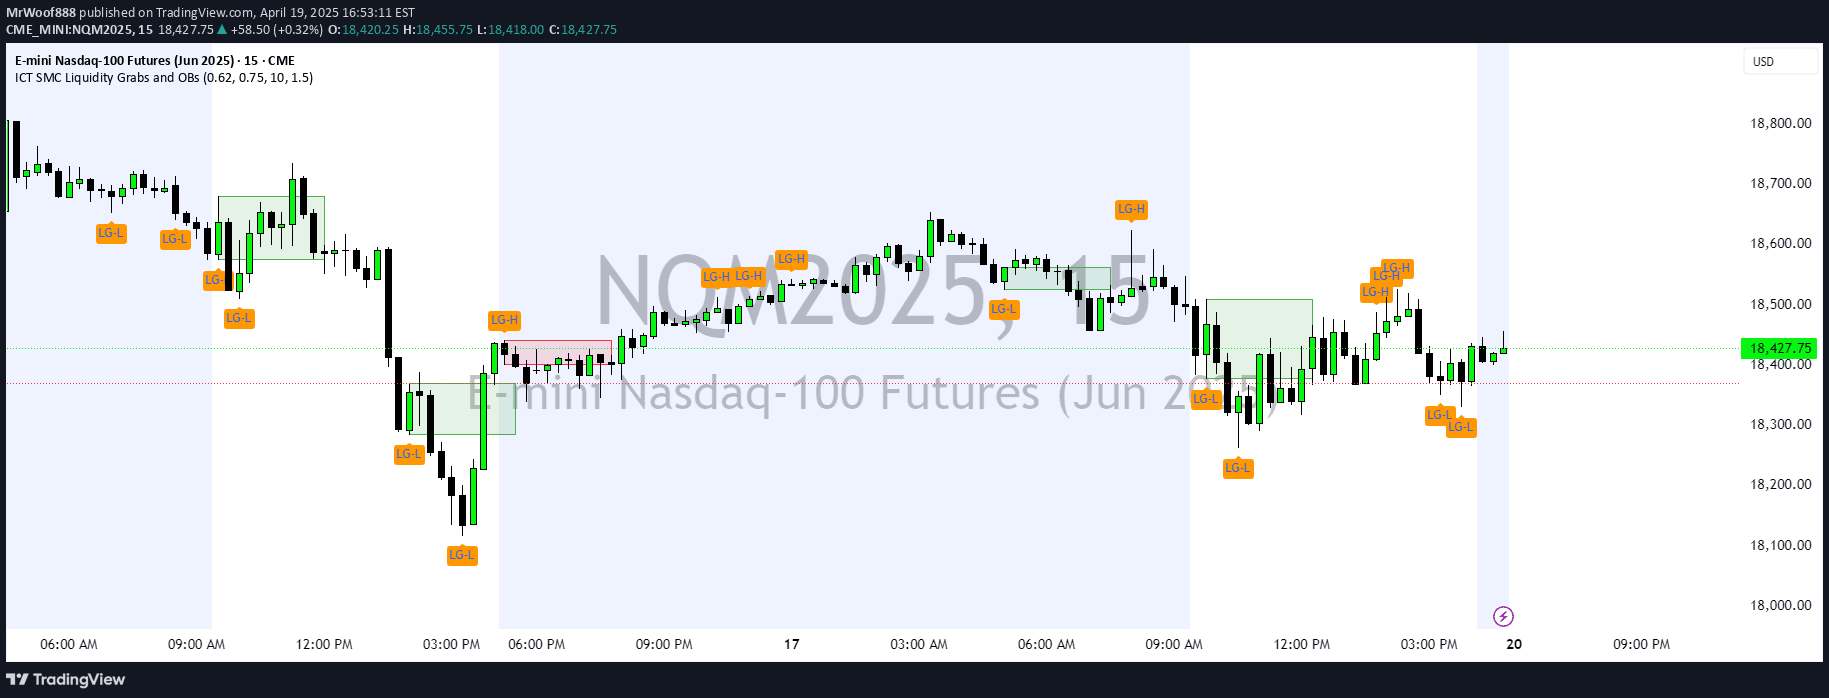
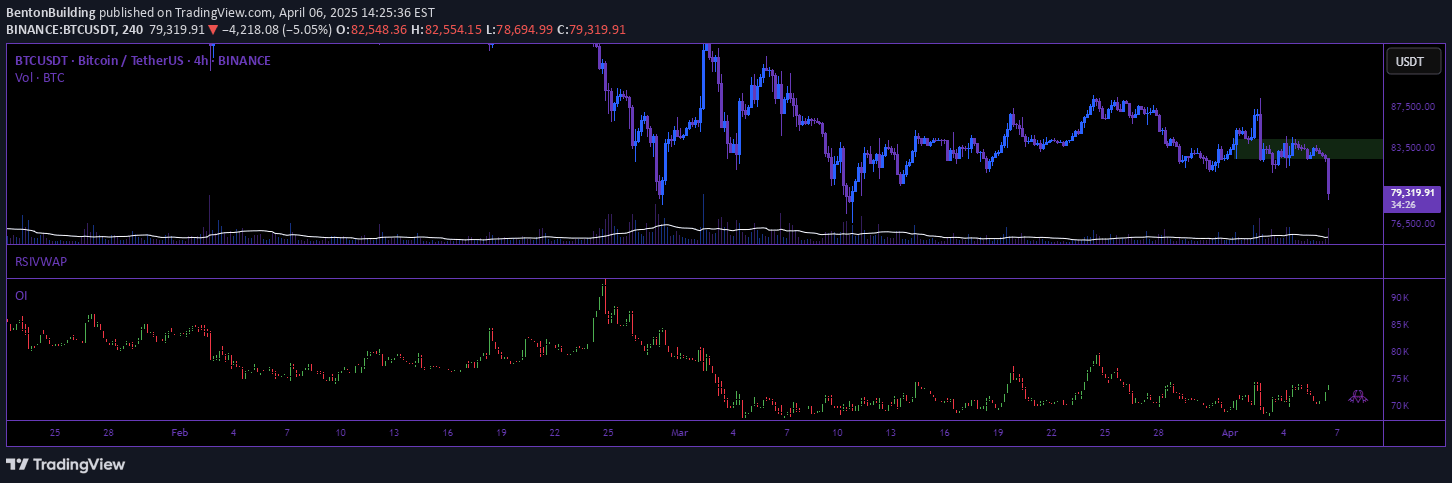
An indicator tracking liquidity levels and Smart Money movements, showing open and liquidated liquidity zones to help traders understand institutional trading strategies.
Explore complementary indicator rolesHow it works
The liquidity indicator operates by mapping out key liquidity zones using solid and dashed lines, representing open and liquidated levels respectively. It tracks institutional trading patterns by identifying areas where Smart Money might execute trades or trigger stop orders.
The indicator provides visual representations of market depth, highlighting potential areas of interest for strategic trading decisions. By analyzing these liquidity zones, traders can gain insights into possible market movements and institutional trading intentions.
Why it may be useful
Understanding liquidity dynamics helps traders anticipate potential market movements and align their strategies with institutional trading patterns. By identifying where Smart Money might be active, traders can make more informed decisions about entry and exit points.
The indicator provides a unique perspective on market structure, revealing hidden trading intentions and potential manipulation strategies that are typically invisible to retail traders. This approach can help traders develop a more sophisticated understanding of market mechanics.
When to explore it
This indicator is most effective in markets with significant institutional participation, such as forex, futures, and major stock indices. Traders should use it during periods of high market activity and when looking to understand potential smart money movements.
It is particularly useful for traders seeking to identify potential liquidity sweeps, stop hunts, and strategic institutional trading zones. The indicator can help traders anticipate potential market reversals or continuation patterns based on liquidity dynamics.
Keep exploring
What we’ve verified
Access, alerts and repainting behaviour have not been independently verified for this indicator. Check the creator’s current publication and settings.
General descriptions and classifications are recovered research. Verified details above identify the specific checks we have completed. Check the creator’s current publication for later changes.