
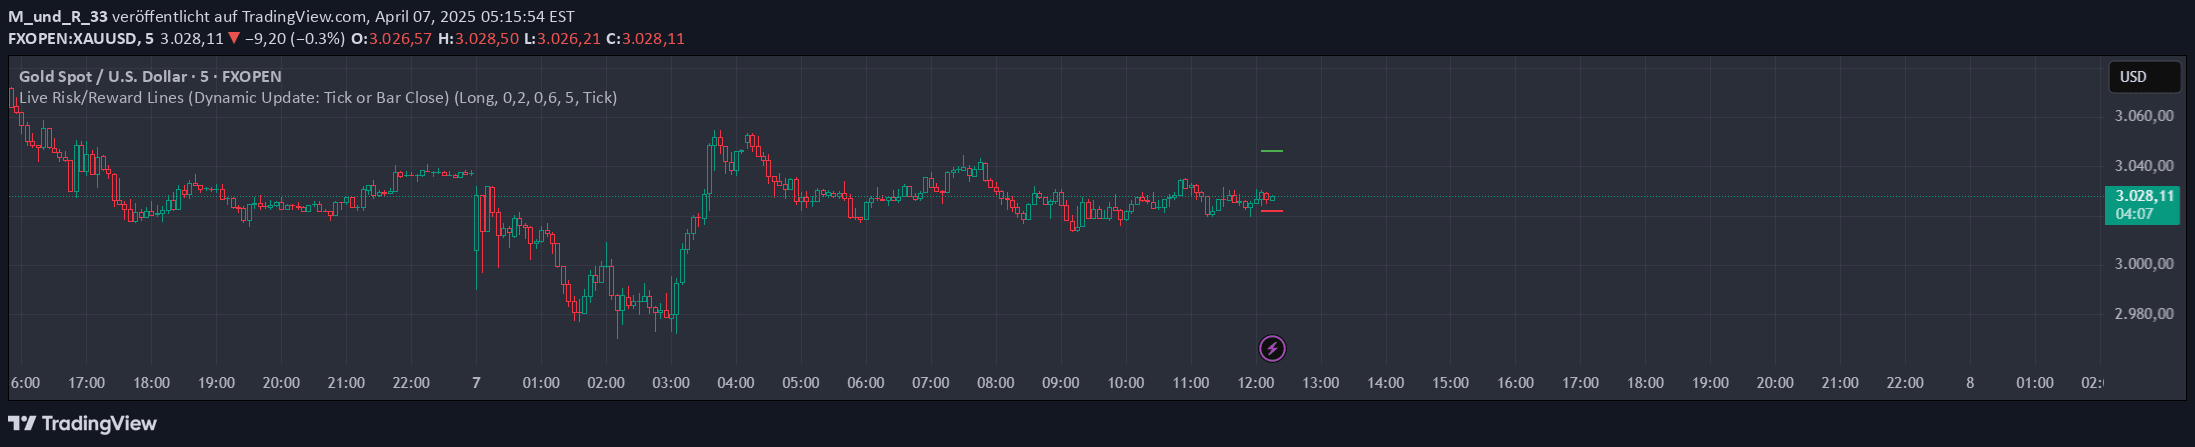
A dynamic risk and reward visualization tool that helps traders set flexible target lines directly on the chart, supporting both long and short trade directions with real-time updates.
Explore complementary indicator rolesHow it works
The script calculates risk and reward lines based on the current close price and predefined percentage values. For long trades, risk is calculated by multiplying the close price by (1 - risk percentage), while reward is calculated by multiplying the close price by (1 + reward percentage).
For short trades, the calculations are reversed. The lines are dynamically centered around the current bar and can update either with each price tick or only when a bar closes, providing traders with flexible visualization of potential price targets
Why it may be useful
This tool offers traders a visual representation of potential risk and reward levels, enabling better trade planning and risk management. Unlike static indicators, it provides real-time dynamic updates that adapt to changing market conditions.
Traders can quickly assess potential profit and loss scenarios directly on their price chart. The flexibility of choosing update frequency and customizing line appearance makes it valuable for different trading styles. By displaying risk and reward lines, traders can make more informed decisions about entry and exit points
When to explore it
This risk and reward visualization tool is most effective during volatile market conditions where price movements are significant. It works well for traders who want to set clear profit targets and stop-loss levels before entering a trade. Scalpers and day traders can benefit from its live update feature, allowing quick adjustments to their trading strategy.
It is particularly useful when trading assets with clear trend movements or during news events that might cause rapid price changes. Traders should use this tool in conjunction with other technical analysis methods for comprehensive market analysis
Keep exploring
What we’ve verified
Access, alerts and repainting behaviour have not been independently verified for this indicator. Check the creator’s current publication and settings.
General descriptions and classifications are recovered research. Verified details above identify the specific checks we have completed. Check the creator’s current publication for later changes.



