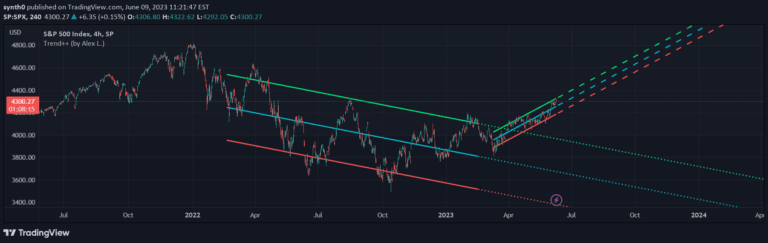
A comprehensive trend detection tool using statistical analysis to identify sustained price movements with adaptive channel detection and high projection confidence.
Explore complementary indicator rolesHow it works
The Long-Term Trend Detector operates by utilizing Pearson's R correlation coefficient to analyze the relationship between price movements and trend projections. It calculates statistical correlations across varying time lengths, dynamically adjusting to market conditions and detecting underlying trend strengths.
By examining extensive historical price data, the indicator generates adaptive trend channels that visually represent potential price trajectories. It considers multiple parameters such as deviation multipliers and statistical correlations to create robust trend identification mechanisms that can assess market movements with high precision.
Why it may be useful
The indicator provides traders with a statistically grounded approach to understanding market trends, reducing emotional decision-making and offering objective trend analysis. By quantifying trend strength through Pearson's R, it gives traders a confidence metric that goes beyond traditional visual trend identification methods.
Its ability to analyze extensive historical data enables traders to gain comprehensive insights into long-term market behaviors. The visual representation of trend channels helps traders quickly understand potential price movements, supporting more informed and strategic trading decisions across various market conditions.
When to explore it
The Long-Term Trend Detector is most effective when analyzing markets with clear, sustained directional movements rather than highly choppy or sideways markets. It performs optimally in timeframes that allow for comprehensive historical analysis, such as daily or weekly charts where longer-term trend patterns can be more reliably identified.
Traders should utilize this indicator when seeking to understand underlying market trends, particularly for swing trading strategies that aim to capture multi-day or multi-week price movements. It is especially valuable during periods of significant market transitions or when evaluating potential long-term investment opportunities across different financial instruments.
Keep exploring
What we’ve verified
Access, alerts and repainting behaviour have not been independently verified for this indicator. Check the creator’s current publication and settings.
General descriptions and classifications are recovered research. Verified details above identify the specific checks we have completed. Check the creator’s current publication for later changes.