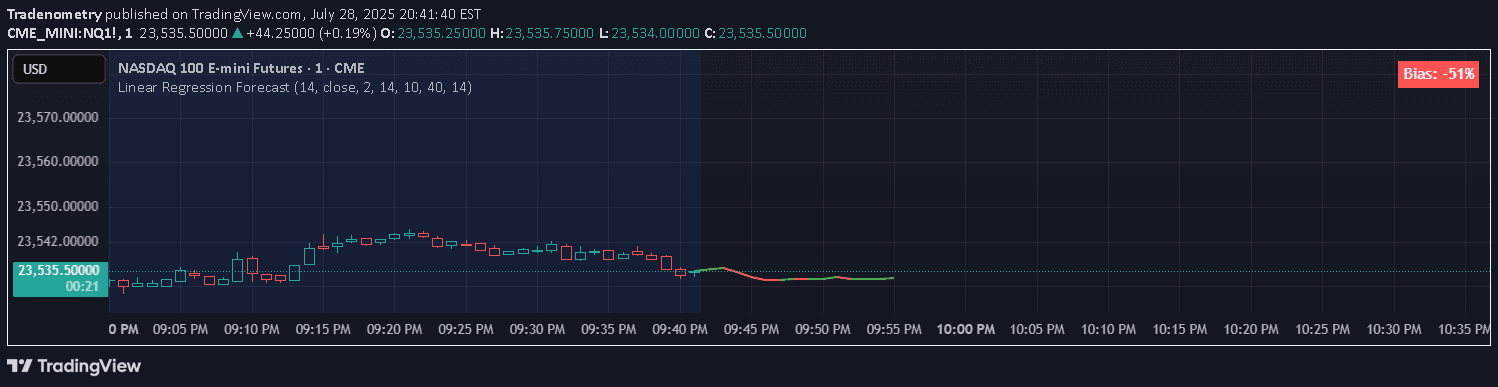
An advanced Linear Regression Channel indicator offering flexible analysis with logarithmic scale and customizable settings for precise trend identification and market interpretation.
Explore complementary indicator rolesHow it works
The Linear Regression Channel works by calculating a best-fit trend line through historical price data, creating a statistical representation of price movement. It uses mathematical regression to plot a central line that represents the most probable price trajectory, then adds upper and lower deviation lines to create a predictive channel.
By offering logarithmic scale and flexible start date options, the indicator can adapt to different market conditions and price ranges. The Pearson correlation coefficient helps traders assess trend strength, while customizable deviation multipliers allow fine-tuning of the channel width to match specific trading strategies and market volatility.
Why it may be useful
The Linear Regression Channel provides traders with a sophisticated tool for understanding market trends and potential price movements beyond traditional technical analysis methods. By normalizing percentage changes across different price levels, it offers a more accurate representation of market dynamics, especially for assets with significant price variations.
The indicator's comprehensive visual customization and multiple alert conditions enable traders to create personalized analysis environments. Its ability to display trend strength through the Pearson correlation coefficient gives additional insight into the reliability of current market movements, helping traders make more informed decision-making strategies.
When to explore it
The Linear Regression Channel is most effective during trending markets where clear directional movements are evident. It works particularly well for analyzing longer-term price trajectories, making it ideal for traders seeking to understand sustained market movements across various timeframes and asset classes.
Traders should utilize this indicator when they want to identify potential support and resistance levels, assess trend reliability, and gain a statistical perspective on price behavior. It is especially useful for comparing performance across different market periods and for developing systematic trading approaches that require precise trend identification.
Keep exploring
What we’ve verified
Access, alerts and repainting behaviour have not been independently verified for this indicator. Check the creator’s current publication and settings.
General descriptions and classifications are recovered research. Verified details above identify the specific checks we have completed. Check the creator’s current publication for later changes.