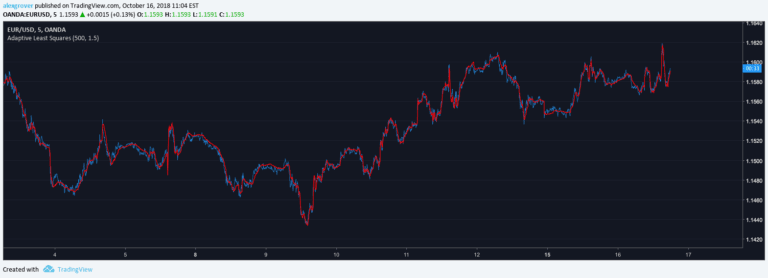
The Least Squares Moving Average (LSMA) is a trend-following indicator that calculates price trends using linear regression, providing a smoother and more responsive alternative to traditional moving averages.
Explore complementary indicator rolesHow it works
The LSMA calculates trend direction using linear regression principles, computing coefficients 'a' and 'b' based on standard deviation, correlation, and simple moving average. It estimates the underlying price trend by creating a linear equation that adapts to price changes.
The indicator uses a unique method of combining weighted moving average (WMA) and simple moving average (SMA) to create a more responsive trend line. By incorporating negative weights, the LSMA can better fit price data and provide a more nuanced trend representation. This approach allows for a more dynamic and responsive trend indicator
Why it may be useful
The LSMA offers traders a more sophisticated trend analysis tool that reduces lag and provides more accurate trend identification compared to traditional moving averages. By using linear regression principles, it can adapt more quickly to changing market conditions and price movements.
Traders can use this indicator to identify trend direction, potential trend reversals, and dynamic support and resistance levels. Its unique calculation method allows for smoother trend representation, helping traders make more informed decisions about market direction and potential entry or exit points
When to explore it
The LSMA works best in markets with clear trending characteristics, such as forex, stocks, and commodities. It is particularly effective during strong bullish or bearish market trends where price movements are more directional. Traders should use the LSMA in conjunction with other technical indicators to confirm trend signals and reduce false positives.
It is most reliable in timeframes ranging from daily to weekly charts, where short-term market noise is minimized. The indicator is especially useful for swing traders and trend-following strategies seeking to capture medium-term price movements
Keep exploring
What we’ve verified
Access, alerts and repainting behaviour have not been independently verified for this indicator. Check the creator’s current publication and settings.
General descriptions and classifications are recovered research. Verified details above identify the specific checks we have completed. Check the creator’s current publication for later changes.