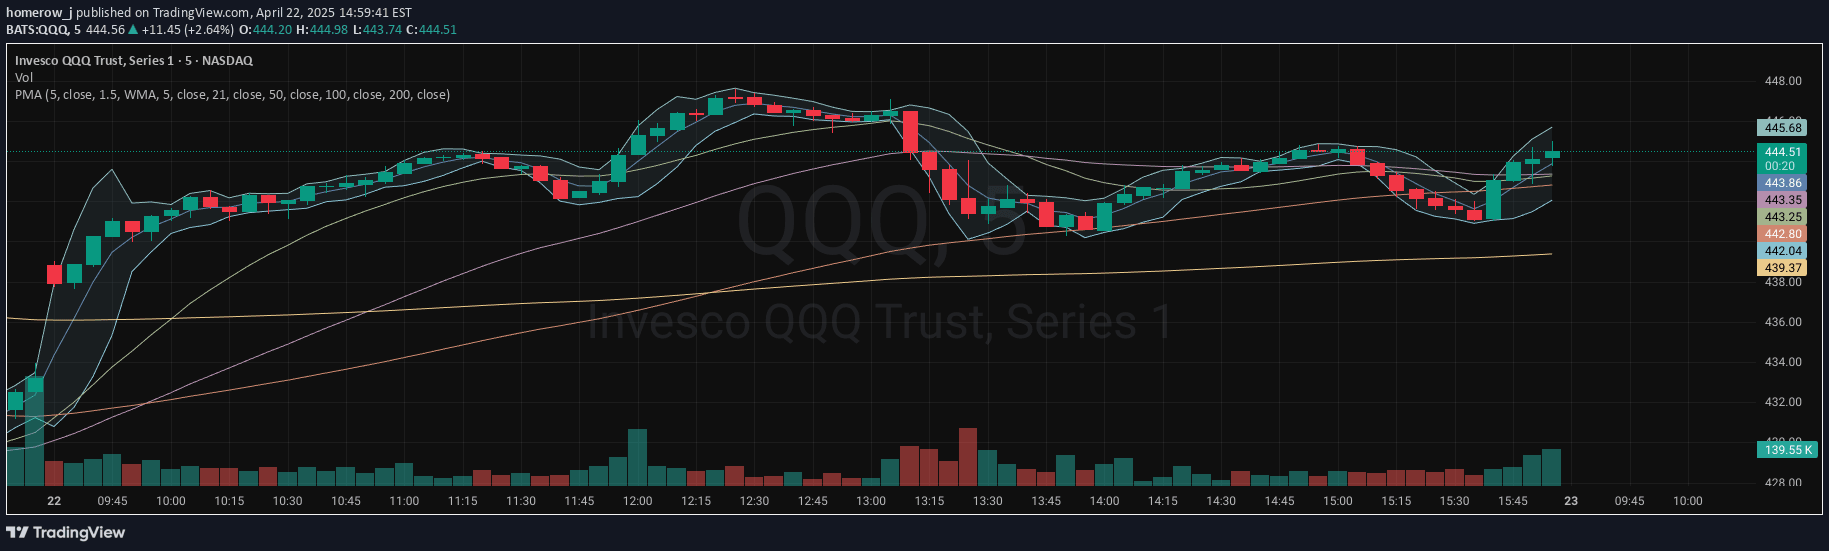
A custom RSI indicator enhanced with SMA and WMA moving averages to provide deeper insights into momentum trends and potential reversal points in market price movements.
Explore complementary indicator rolesHow it works
The indicator starts by calculating a 14-period Relative Strength Index (RSI) based on closing prices, which measures the magnitude of recent price changes to evaluate overbought or oversold conditions. Simple Moving Average (SMA) and Weighted Moving Average (WMA) are then applied to the RSI to smooth out its trends and provide additional analytical depth.
The SMA gives equal weight to all RSI values in its period, creating a consistent trend line, while the WMA assigns more significance to recent RSI values, making it more responsive to immediate price momentum shifts. By combining these moving averages with the base RSI, traders can gain a more nuanced view of potential trend reversals and momentum changes.
Why it may be useful
This advanced RSI indicator offers traders a more sophisticated approach to momentum analysis by integrating multiple smoothing techniques. The combination of RSI with SMA and WMA helps reduce market noise and provides clearer signals about potential trend changes, making it easier to identify key entry and exit points.
By establishing clear overbought (70) and oversold (30) levels with visual horizontal lines, the indicator makes it simpler for traders to quickly assess market conditions. The multiple moving average layers add depth to momentum analysis, allowing traders to distinguish between temporary fluctuations and more significant trend shifts.
When to explore it
The custom RSI indicator is most effective in markets with clear trending or ranging characteristics, where momentum signals can provide reliable insights. It works particularly well in volatile markets where quick identification of potential reversals can be crucial for making timely trading decisions.
Traders should apply this indicator across various timeframes, from short-term scalping to longer-term swing trading, as its multi-layered approach to momentum analysis offers flexibility. It is especially useful during periods of market uncertainty, when traditional single-indicator approaches might provide incomplete or misleading signals.
Keep exploring
What we’ve verified
Access, alerts and repainting behaviour have not been independently verified for this indicator. Check the creator’s current publication and settings.
General descriptions and classifications are recovered research. Verified details above identify the specific checks we have completed. Check the creator’s current publication for later changes.