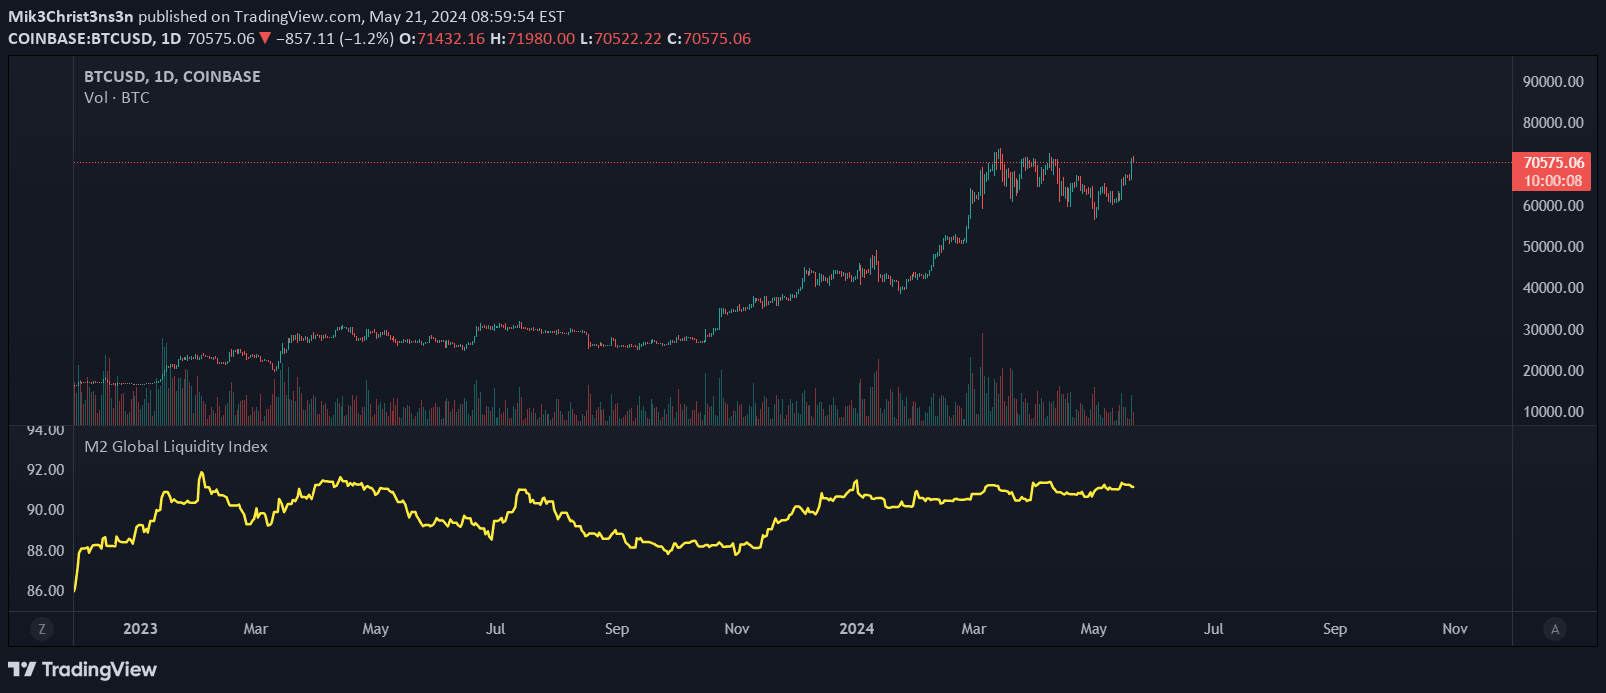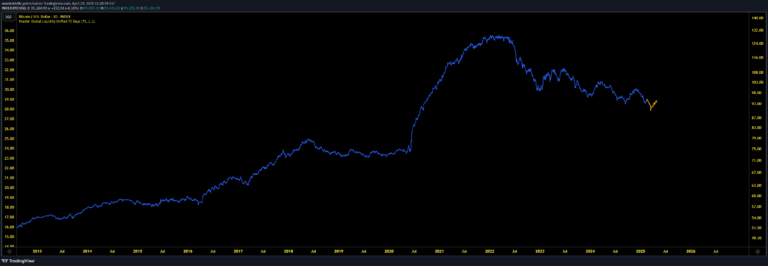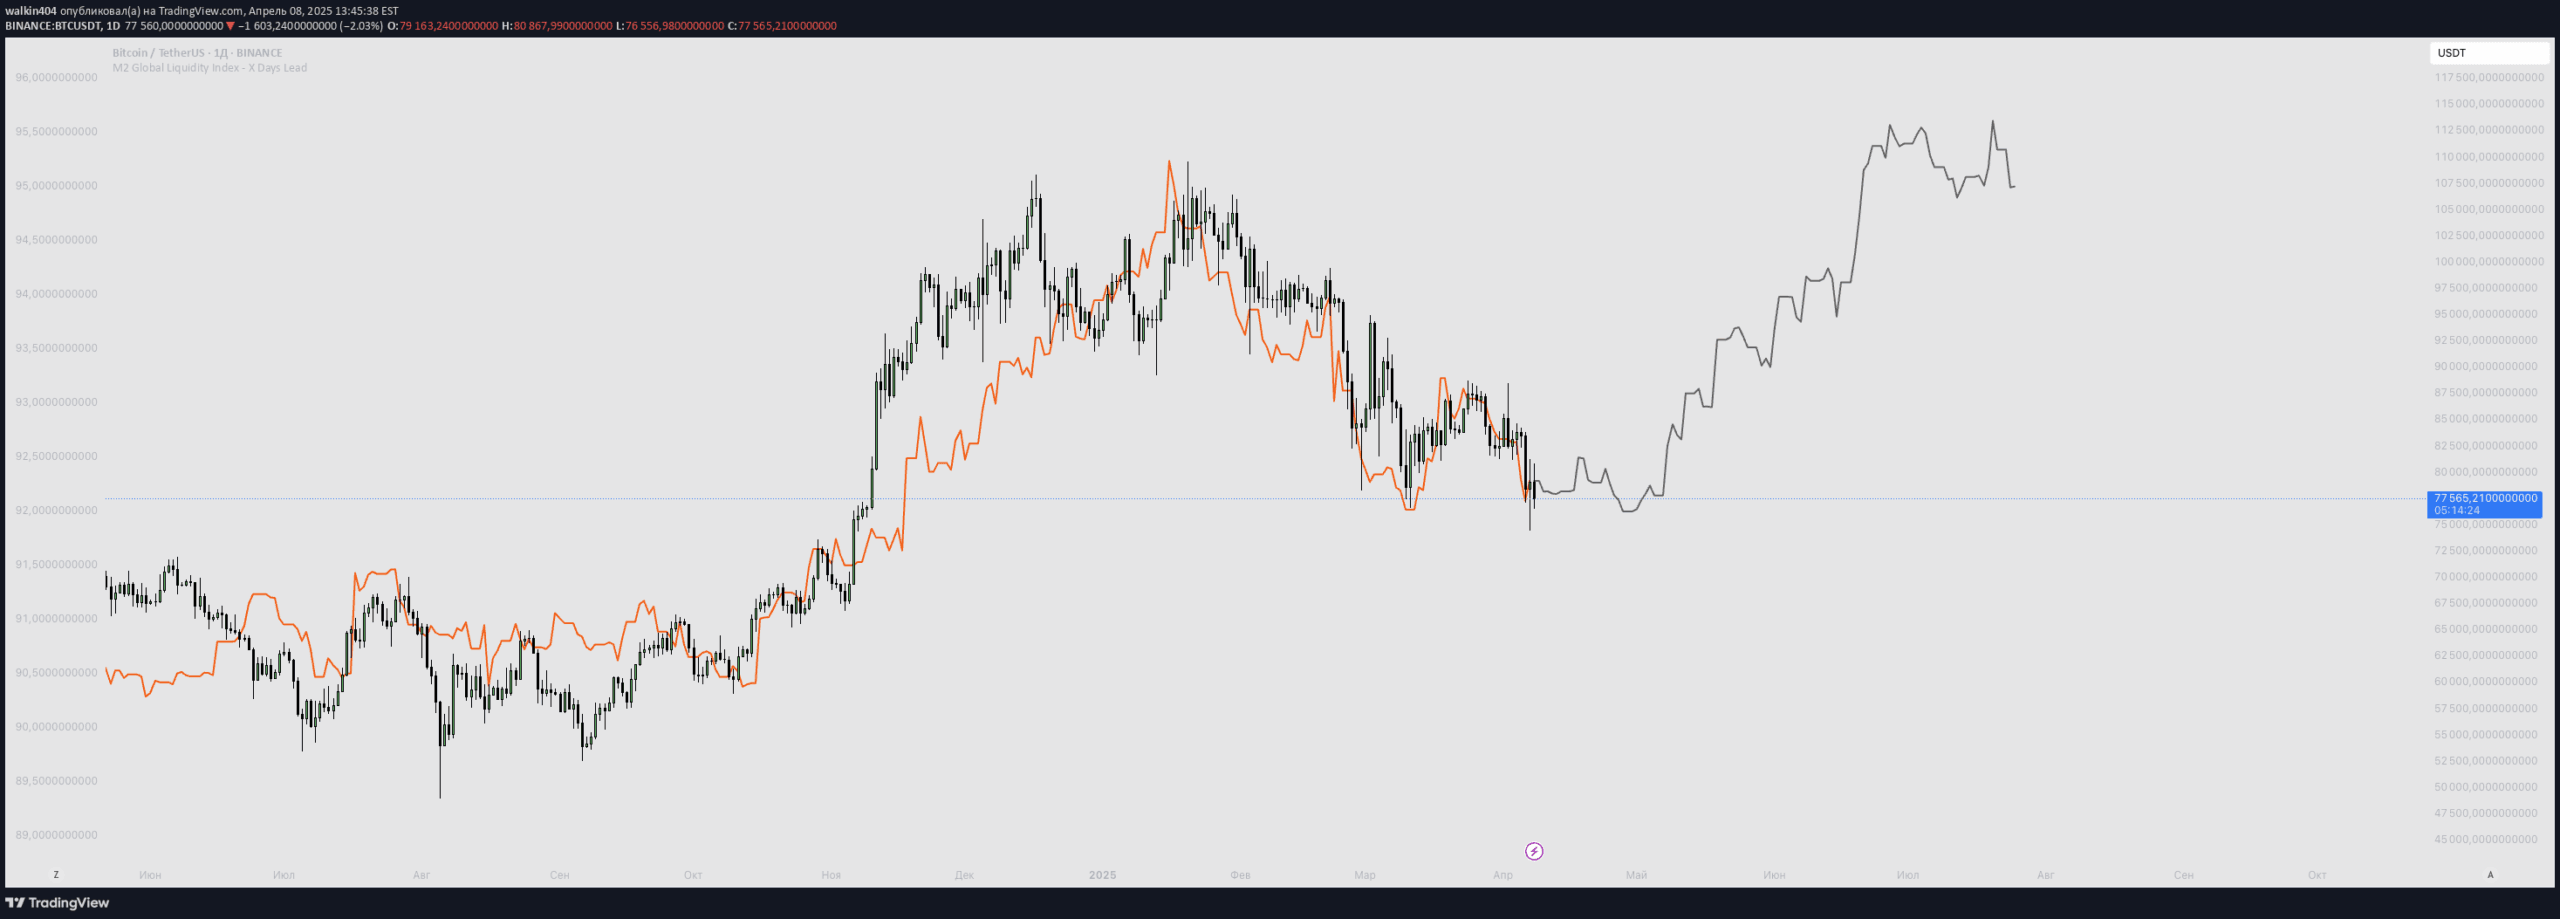
A custom indicator overlaying Bitcoin price with Global Liquidity M2 data, revealing potential correlations between monetary supply and cryptocurrency price movements.
Explore complementary indicator rolesHow it works
The indicator plots two segments of the Global Liquidity M2 chart on the Bitcoin price chart. The past segment is displayed in one color, representing historical monetary supply data.
The future segment is shown in a different color, indicating potential upcoming liquidity trends. By comparing these segments with Bitcoin's price movements, traders can visually analyze potential relationships between monetary supply and cryptocurrency price dynamics
Why it may be useful
Understanding monetary supply's impact on Bitcoin is crucial for traders seeking deeper market insights. This indicator provides a unique visualization of how global liquidity might influence cryptocurrency prices.
By displaying past and future liquidity data, traders can identify potential correlations and make more informed investment decisions. The visual representation helps traders quickly grasp complex economic relationships that might affect Bitcoin's value
When to explore it
This indicator works best during periods of significant economic changes or monetary policy shifts. It is particularly useful for long-term investors and swing traders interested in macroeconomic trends.
Traders should pay close attention when central banks announce monetary policy changes or during global economic events. The indicator can help identify potential long-term trends and provide context for Bitcoin's price movements
Keep exploring
What we’ve verified
Access, alerts and repainting behaviour have not been independently verified for this indicator. Check the creator’s current publication and settings.
General descriptions and classifications are recovered research. Verified details above identify the specific checks we have completed. Check the creator’s current publication for later changes.