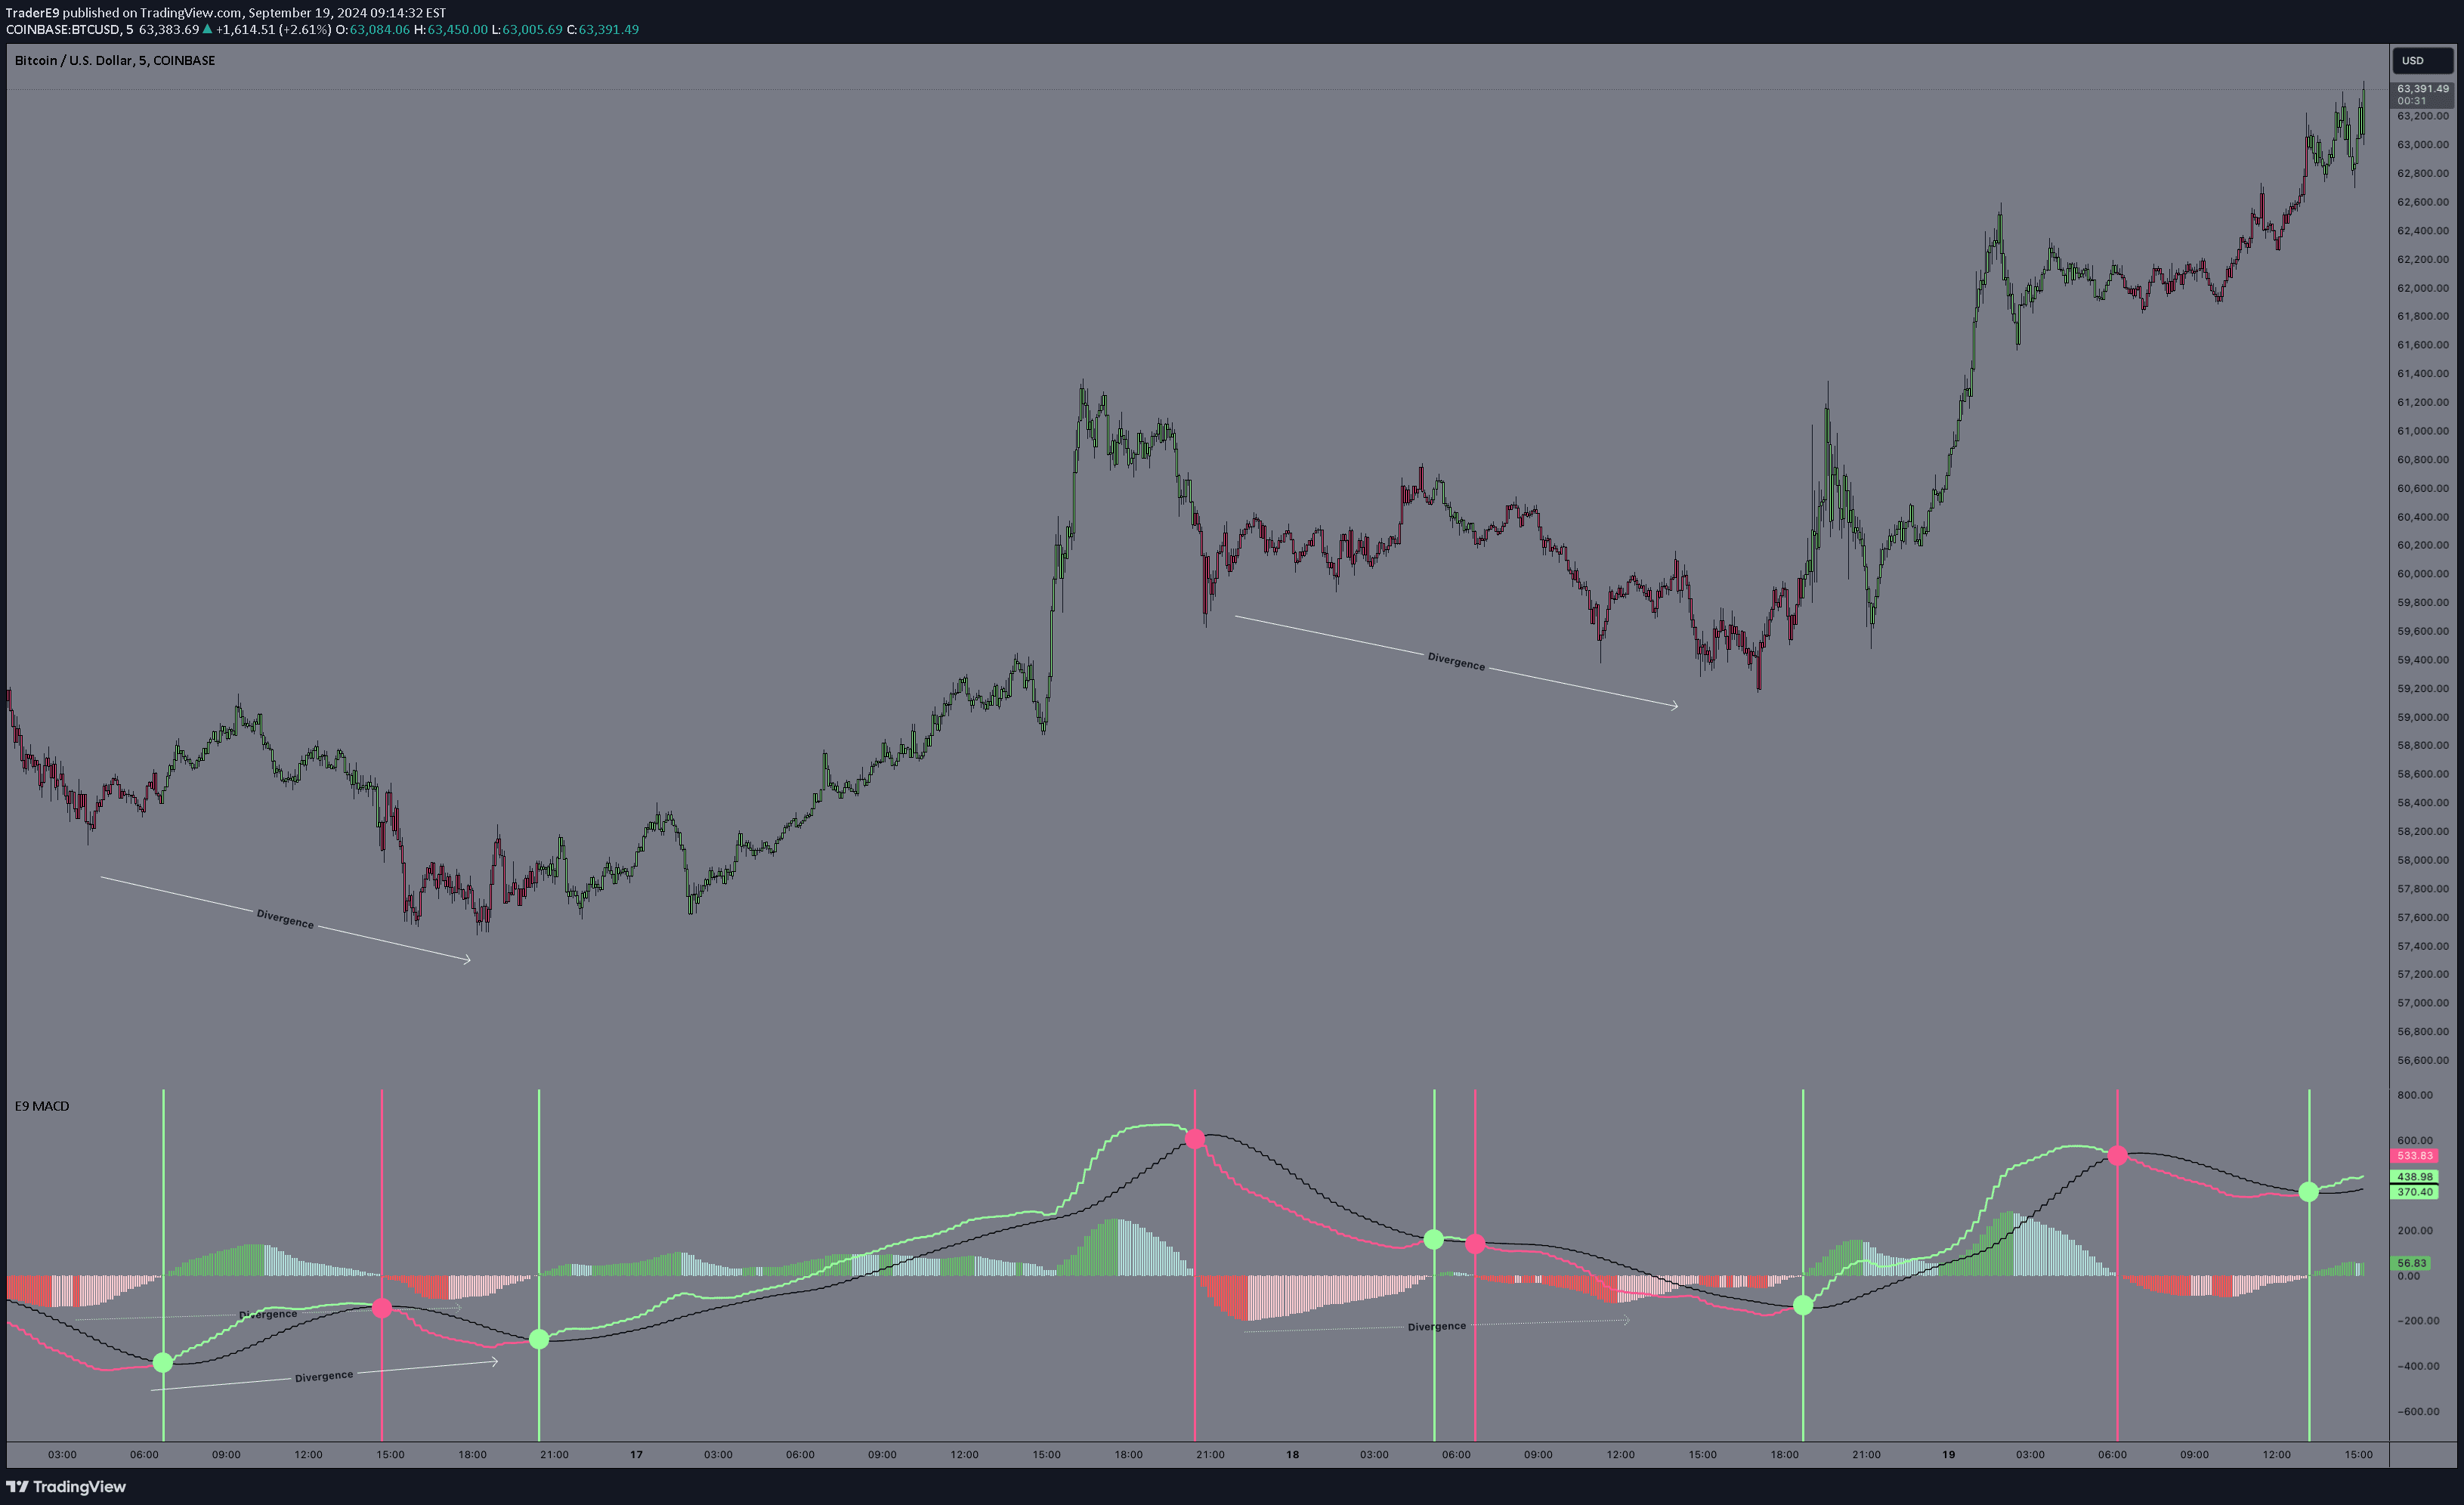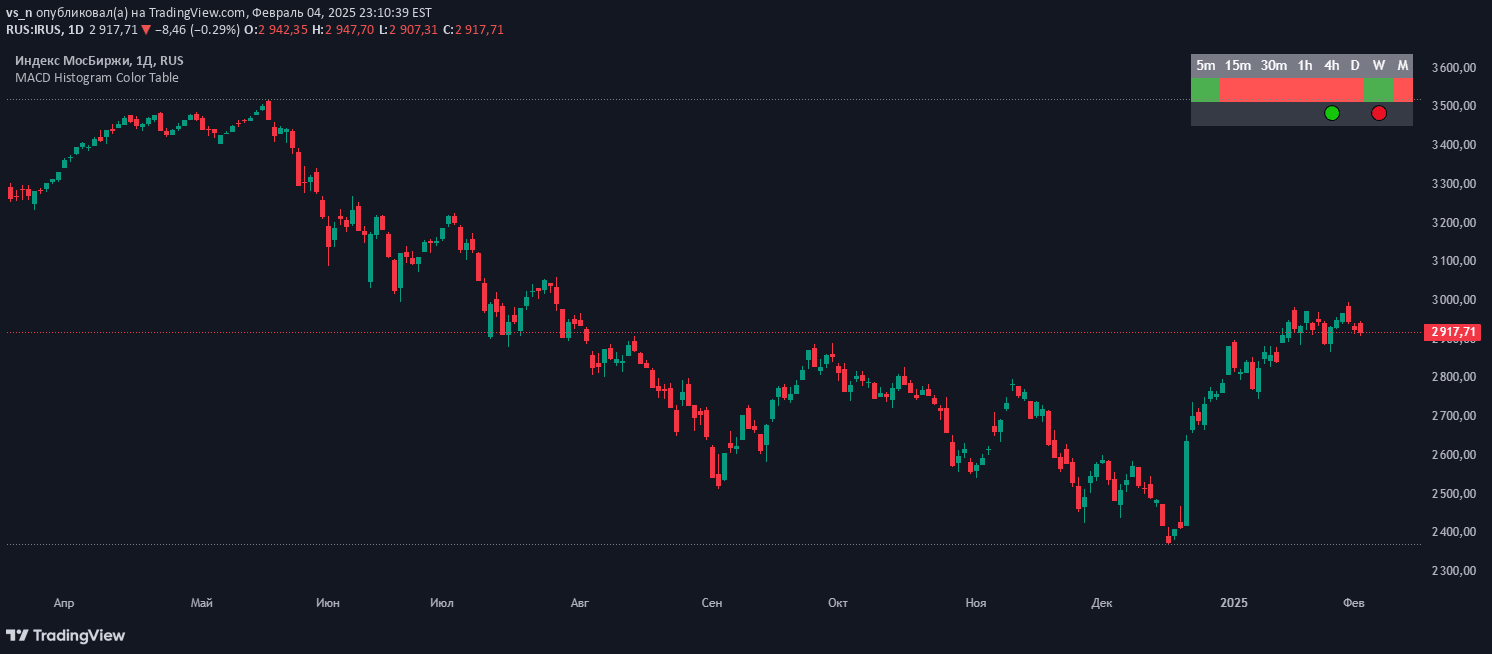
A multi-timeframe MACD histogram analysis tool that displays color-coded histogram status and identifies potential trend reversals through divergence detection across different timeframes.
Explore complementary indicator rolesHow it works
The MACD multi-timeframe signal works by systematically analyzing the Moving Average Convergence Divergence (MACD) histogram across different time intervals. It creates a comprehensive table with color-coded cells representing the MACD histogram's status in each timeframe, using green for positive and red for negative histogram values.
The system also incorporates a divergence detection mechanism that identifies potential trend reversals by comparing price action with MACD histogram movements. By examining multiple timeframes simultaneously, traders can gain a more holistic view of momentum and potential trend changes, with visual indicators like green and red circles highlighting bullish and bearish divergences.
Why it may be useful
This multi-timeframe MACD analysis provides traders with a powerful tool for understanding market momentum and potential trend reversals across different time intervals. By presenting complex technical information in an easily digestible visual format, the signal helps traders quickly assess market conditions and make more informed trading decisions.
The color-coded histogram and divergence detection offer traders a nuanced view of market dynamics, allowing them to spot potential trend changes and momentum shifts that might be missed when examining a single timeframe. This comprehensive approach enhances traders' ability to identify high-probability trading opportunities and manage risk more effectively.
When to explore it
The multi-timeframe MACD signal is most effective during periods of market volatility and when traders want to confirm trend strength across different time intervals. It works particularly well in markets with clear momentum trends, helping traders identify potential entry and exit points by analyzing histogram colors and divergence signals.
Traders should use this signal in conjunction with other technical analysis tools to validate potential trading opportunities. It is especially useful for short-term trading strategies like scalping and day trading, where rapid identification of momentum shifts can provide a competitive edge in decision-making.
Keep exploring
What we’ve verified
Access, alerts and repainting behaviour have not been independently verified for this indicator. Check the creator’s current publication and settings.
General descriptions and classifications are recovered research. Verified details above identify the specific checks we have completed. Check the creator’s current publication for later changes.