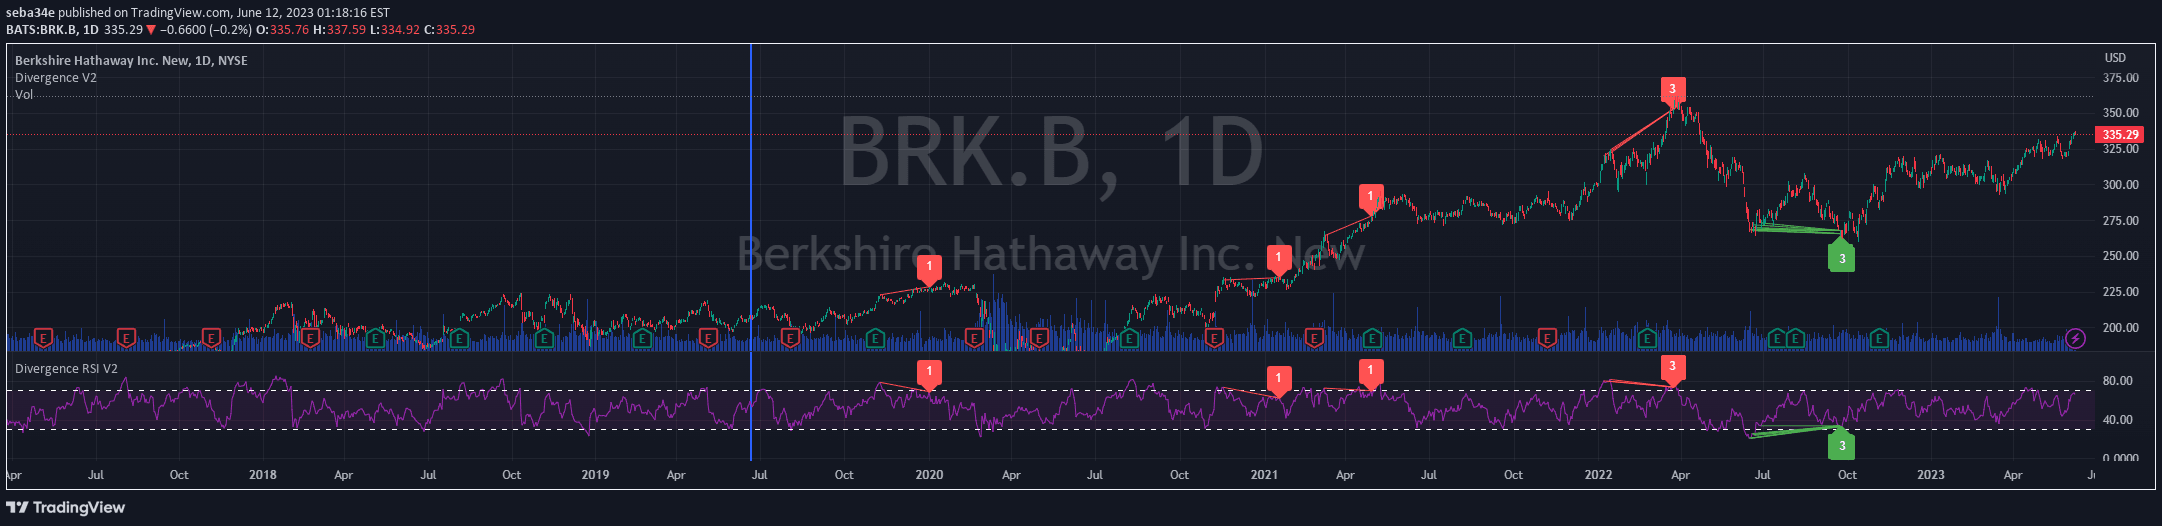
Advanced RSI indicator that combines multiple technical analysis tools to provide comprehensive market insights through RSI, moving averages, divergence detection, and support/resistance levels.
Explore complementary indicator rolesHow it works
The indicator calculates the Relative Strength Index (RSI) with a configurable period and applies exponential and weighted moving averages to smooth the signal. It plots horizontal lines at predefined RSI levels to create a price ladder that estimates potential price targets based on historical gains and losses.
Additionally, the indicator automatically detects bullish and bearish divergences by comparing price action with RSI movements. It identifies key support and resistance levels on the RSI using multiple lookback periods, helping traders recognize potential trend reversals and market dynamics.
Why it may be useful
This advanced RSI indicator provides traders with a multi-layered analysis of market momentum and potential trend changes. By integrating various technical analysis tools, it offers a more comprehensive view of market conditions beyond traditional single-indicator approaches.
The indicator's flexibility allows traders to customize parameters, making it adaptable to different trading styles and market conditions. Its ability to detect divergences, estimate price targets, and identify support/resistance levels can help traders make more informed decisions and develop more sophisticated trading strategies.
When to explore it
The RSI indicator works best in markets with clear trending or ranging conditions, particularly when price is experiencing significant momentum shifts. It is most effective when used in conjunction with other technical analysis tools to confirm signals and reduce false positives.
Traders should focus on using this indicator during periods of moderate to high market volatility, where RSI levels and divergences can provide meaningful insights into potential trend reversals or continuation patterns. It is particularly useful for identifying overbought and oversold conditions across various timeframes.
Keep exploring
What we’ve verified
Access, alerts and repainting behaviour have not been independently verified for this indicator. Check the creator’s current publication and settings.
General descriptions and classifications are recovered research. Verified details above identify the specific checks we have completed. Check the creator’s current publication for later changes.