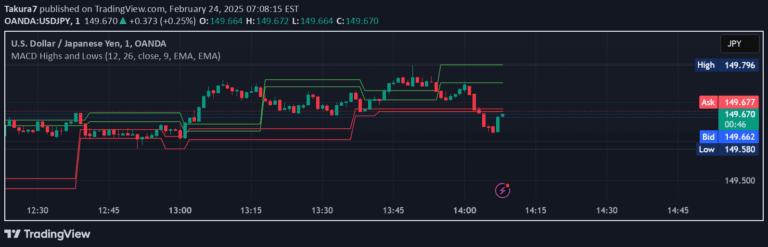
A dynamic MACD-powered support and resistance mapping tool that generates structural levels based on momentum crossovers, helping traders identify potential market reversal and continuation zones.
Explore complementary indicator rolesHow it works
The indicator uses MACD crossover events as triggers to generate dynamic support and resistance levels. When the MACD line crosses above its signal line, the script scans the last 5 bars for the lowest low and plots a support level. Conversely, when MACD crosses below its signal line, it identifies the highest high in the recent bars and marks a resistance level.
The system maintains a maximum of 20 active levels, automatically removing older or invalidated levels to keep the chart clean and focused. Levels are deleted if price closes below a support level or above a resistance level, ensuring that only currently relevant structural zones remain visible.
Why it may be useful
By linking momentum indicator crossovers with recent price extremes, traders gain insights into potential market sentiment shifts and reaction zones. The tool transforms the traditional MACD oscillator into a structural awareness system that highlights precise areas where price might reverse, continue, or encounter significant market activity.
The visual markers and contextual lines help traders understand market dynamics more intuitively, providing a comprehensive view of momentum and structural interactions. This approach reduces guesswork and offers a more systematic method for identifying potential entry and exit points across different trading timeframes.
When to explore it
This signal works best in markets with clear momentum shifts and identifiable trend structures, such as forex, stocks, and cryptocurrency markets. Traders can utilize these levels during breakout strategies, trend continuation plays, and potential reversal scenarios, particularly when combined with other technical confluence tools.
The indicator is especially valuable during periods of moderate to high market volatility, where momentum changes can signal significant price movements. Traders should pay close attention to the MACD diamond markers and use the local high/low reference lines to assess overall market momentum and potential trading opportunities.
Keep exploring
What we’ve verified
Access, alerts and repainting behaviour have not been independently verified for this indicator. Check the creator’s current publication and settings.
General descriptions and classifications are recovered research. Verified details above identify the specific checks we have completed. Check the creator’s current publication for later changes.