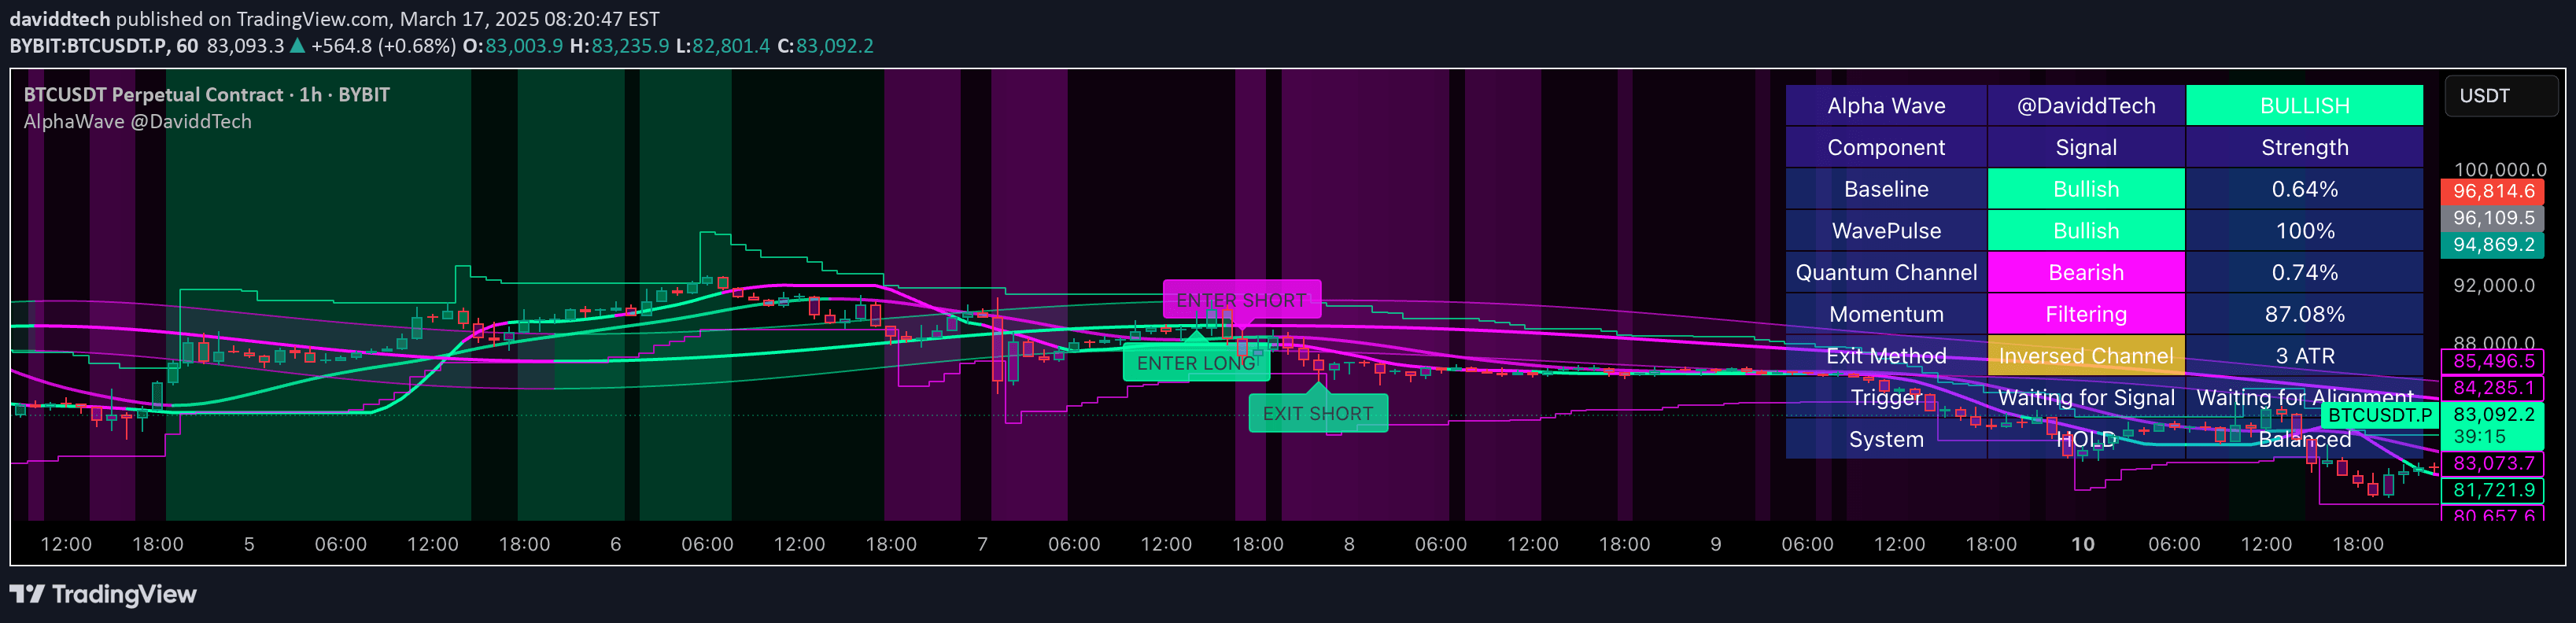
A probabilistic technical indicator using OLS regression that analyzes price action dynamics, generating a continuous probability signal ranging from -1 to 1 with ATR-based volatility context.
Explore complementary indicator rolesHow it works
The Neural Pulse System (NPS) employs Ordinary Least Squares (OLS) regression to compute dynamic probabilities of price movement. It calculates regression coefficients in real-time, adapting to evolving market conditions and generating a smooth probability output between -1 and 1.
The system incorporates Average True Range (ATR) bands to provide volatility context, which helps frame price movements and prevent extreme deviations. By transforming regression outputs and scaling them, the indicator creates a nuanced view of market momentum that goes beyond traditional binary trend indicators.
Why it may be useful
The Neural Pulse System offers traders a more sophisticated approach to trend analysis by providing a continuous probability signal instead of rigid, binary trend classifications. Its dynamic coefficient calculation allows for more responsive and adaptive trend detection, helping traders identify subtle shifts in market sentiment more effectively.
By integrating volatility context through ATR bands, the indicator helps traders understand not just trend direction, but also the potential strength and reliability of that trend. This multi-dimensional approach provides deeper insights into market behavior, enabling more informed trading decisions across different market conditions.
When to explore it
The Neural Pulse System is particularly effective in markets with clear trending characteristics, where price movements show consistent directional momentum. It performs exceptionally well in timeframes ranging from short-term (scalping) to medium-term (swing trading), allowing flexibility across different trading styles.
Traders should leverage this indicator during periods of moderate to high market volatility, where its ATR-based bands can help contextualize price action. It is especially useful when confirming trend reversals, identifying potential breakout points, and assessing the underlying strength of bullish or bearish market movements.
Keep exploring
What we’ve verified
Access, alerts and repainting behaviour have not been independently verified for this indicator. Check the creator’s current publication and settings.
General descriptions and classifications are recovered research. Verified details above identify the specific checks we have completed. Check the creator’s current publication for later changes.