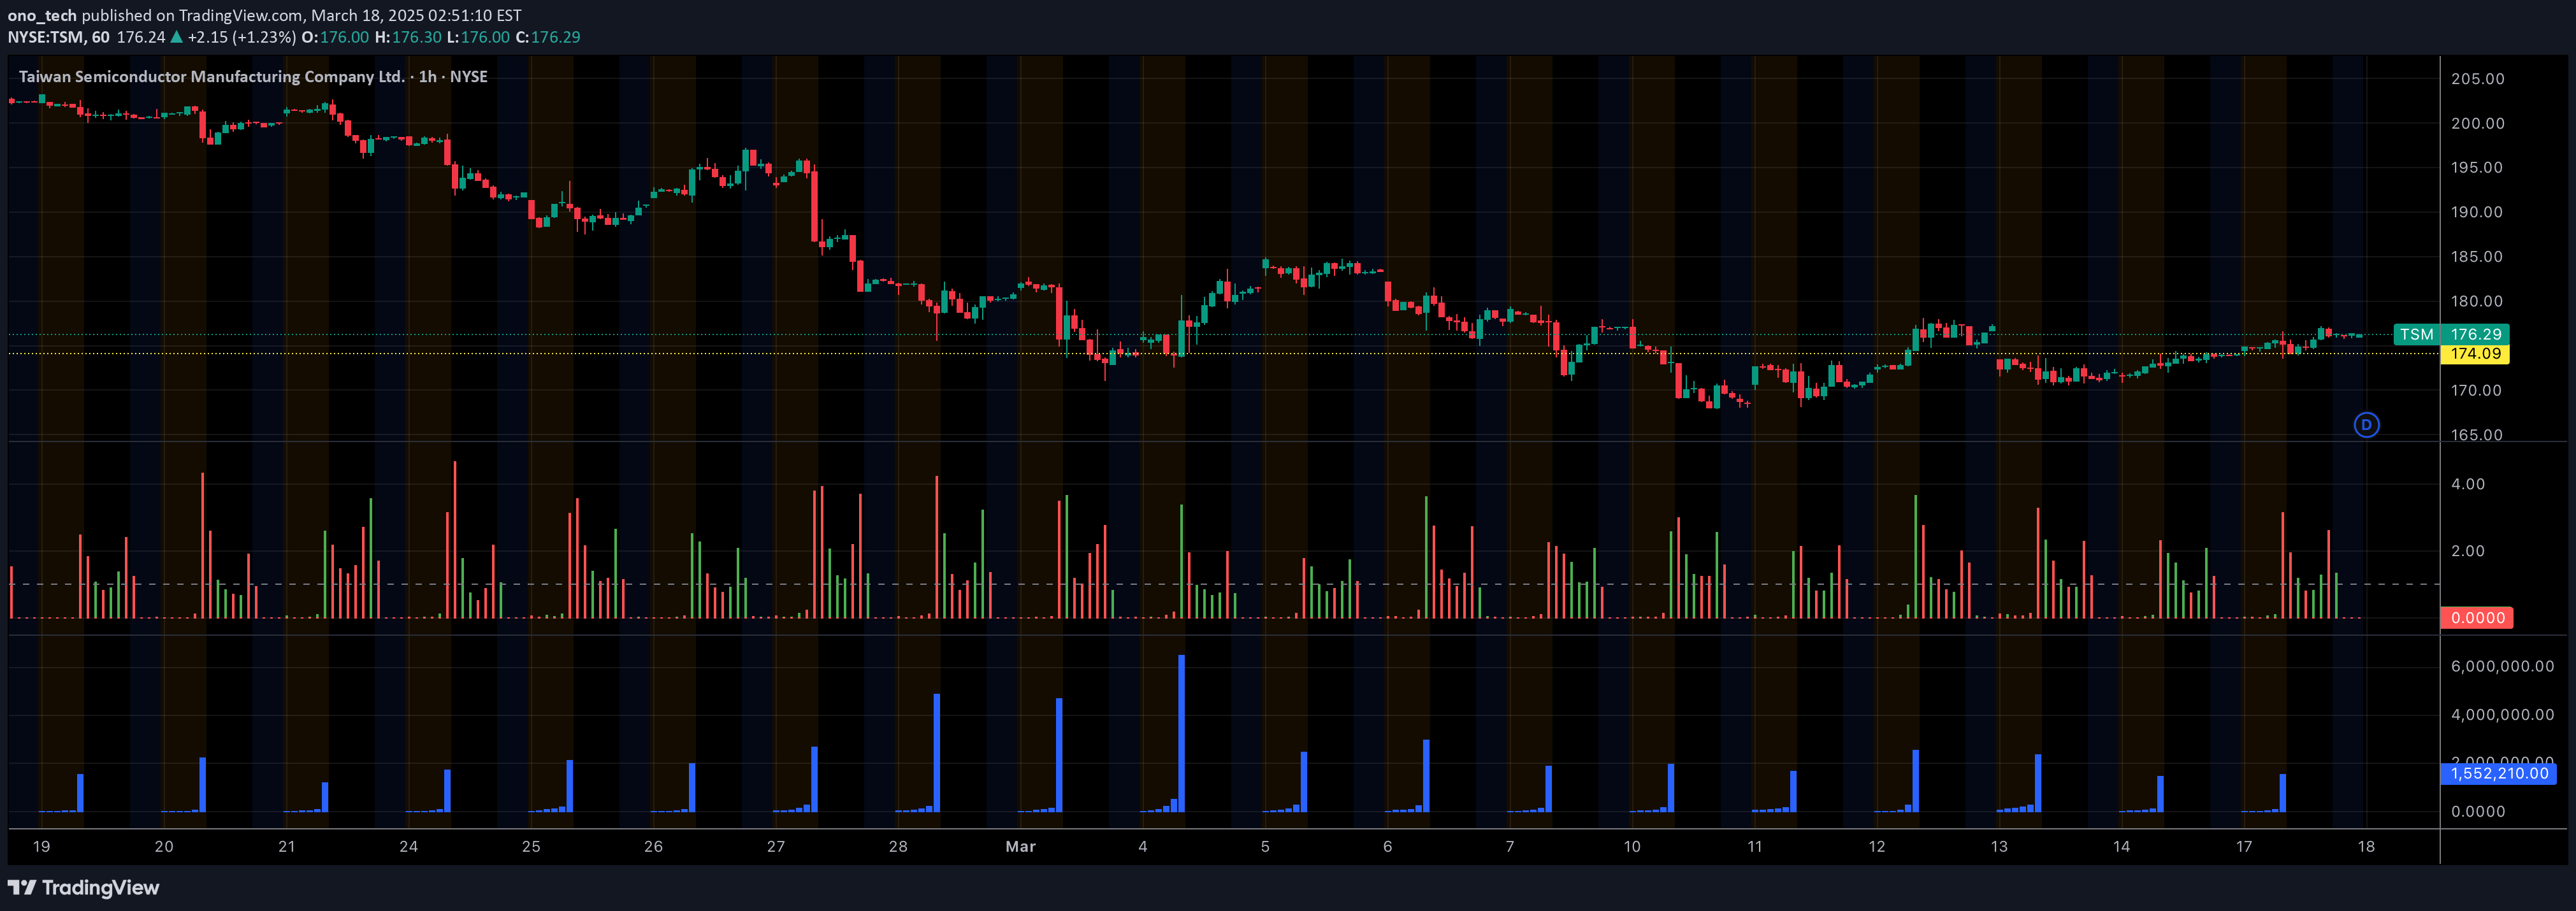
A volume-based indicator tracking pre-market and intraday relative volume percentages, helping traders assess potential trading opportunities through volume intensity measurements.
Explore complementary indicator rolesHow it works
The indicator calculates pre-market volume percentage relative to the average trading volume over 14 days, presenting the data in a visual table format. It compares current volume against historical averages, using color-coded indicators to highlight significant volume changes.
For each trading timeframe, the signal measures relative volume per candle, with specific thresholds for volume intensity. Volumes between 250-350% are marked orange, while volumes exceeding 350% are highlighted green, providing quick visual cues about trading activity.
Why it may be useful
Volume indicators are crucial for understanding market dynamics and potential price movements, offering traders insights into the strength and conviction behind price actions. By measuring volume intensity, traders can identify potential trend confirmations or reversals before they become obvious on price charts.
This specific indicator provides a nuanced view of trading activity, helping traders assess market sentiment and potential momentum shifts. It allows quick identification of unusual trading volumes that might signal important market events or potential trading opportunities.
When to explore it
The indicator is most effective during active trading sessions, particularly for short-term trading strategies like scalping and day trading. It works best in liquid markets with consistent trading volumes, where volume variations can provide meaningful signals about potential price movements.
Traders should use this indicator in conjunction with other technical analysis tools to confirm signals and reduce false positives. It is particularly useful for identifying potential breakout scenarios, volume-driven trend changes, and assessing overall market activity.
Keep exploring
What we’ve verified
Access, alerts and repainting behaviour have not been independently verified for this indicator. Check the creator’s current publication and settings.
General descriptions and classifications are recovered research. Verified details above identify the specific checks we have completed. Check the creator’s current publication for later changes.