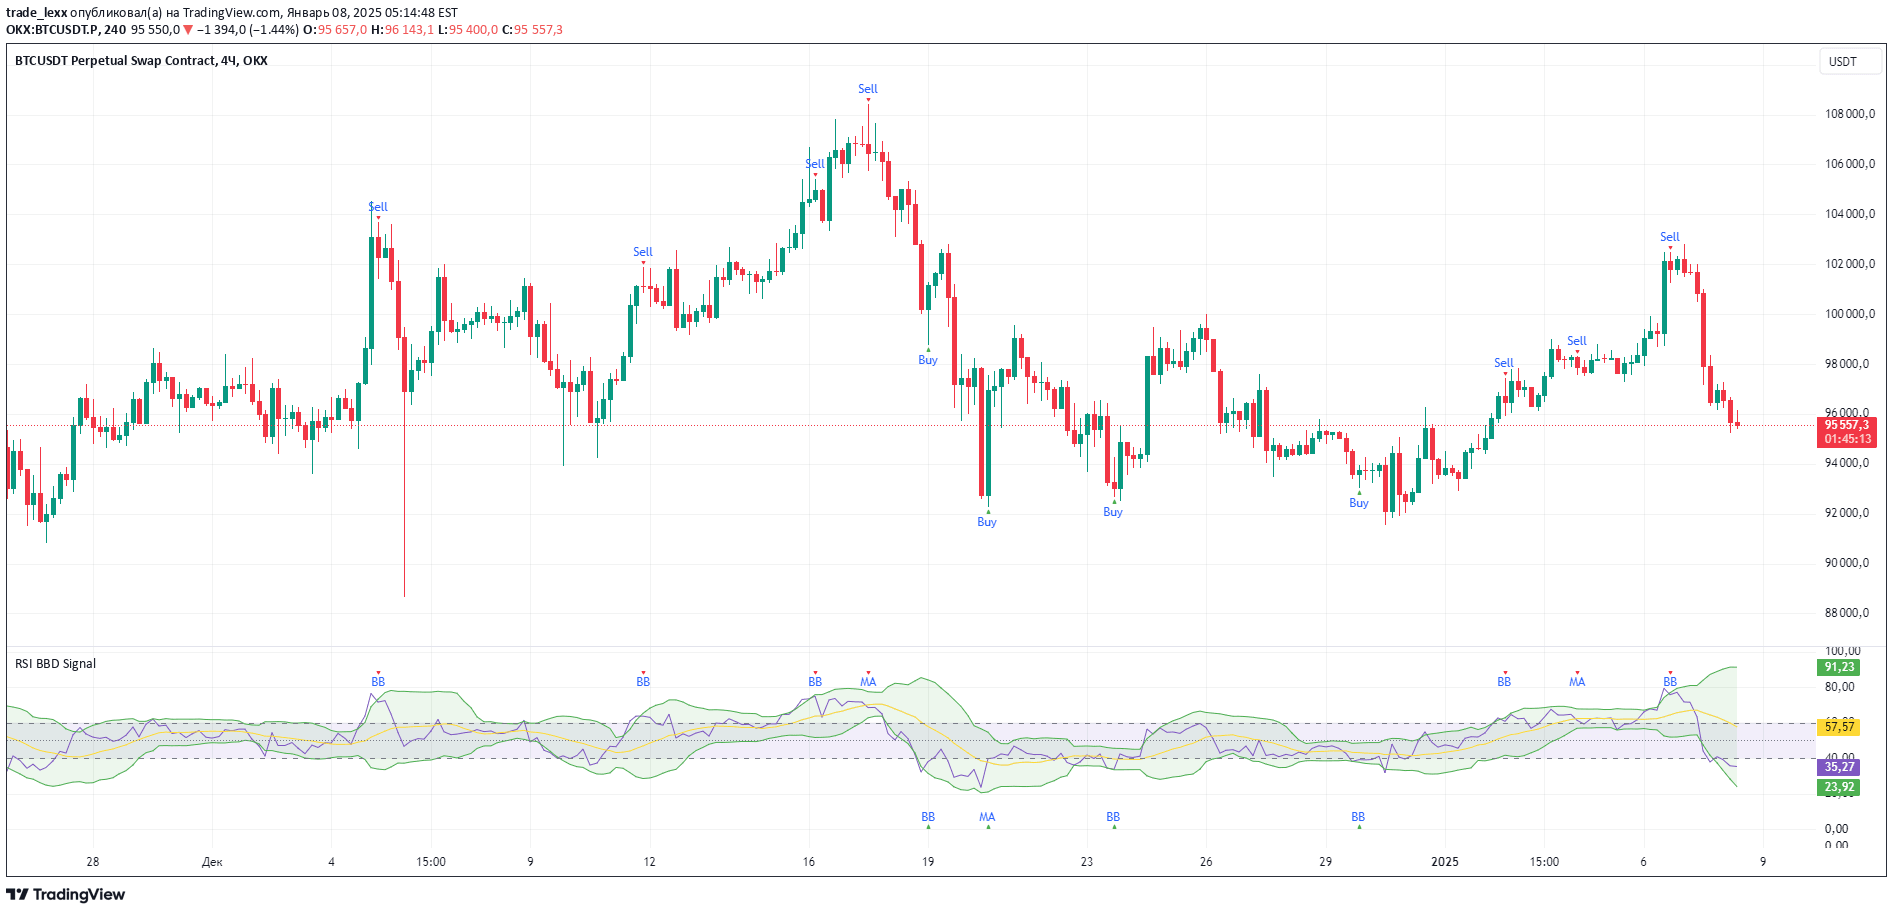
A market structure RSI that combines RSI with trend analysis to identify potential market reversals and trading opportunities by examining price structure and momentum.
Explore complementary indicator rolesHow it works
The Market Structure RSI works by calculating a custom Relative Strength Index (RSI) that specifically analyzes market structure through the formation of higher highs and lower lows. It dynamically tracks the momentum of price movements by examining how prices create new structural points, allowing for a more nuanced interpretation of market strength and weakness.
The indicator generates signals by tracking the RSI's movement relative to predefined overbought and oversold levels, with optional moving average smoothing to refine signal accuracy. When the RSI crosses above the oversold level, it generates a bullish signal, suggesting potential long entry, while crossing below the overbought level produces a bearish signal indicating a potential short entry.
Why it may be useful
The Market Structure RSI provides traders with a sophisticated tool that goes beyond traditional RSI by incorporating market structure analysis, offering a more comprehensive view of price momentum and potential trend reversals. By considering the formation of higher highs and lower lows, this indicator helps traders identify more precise entry and exit points, reducing the likelihood of false signals.
Its flexibility in customization allows traders to adapt the indicator to various market conditions and trading styles, making it a versatile tool for technical analysis. The visual enhancements, such as gradient fills and signal markers, help traders quickly interpret market conditions and potential trading opportunities.
When to explore it
The Market Structure RSI is most effective in trending markets where clear directional movements are present, providing reliable signals during strong bullish or bearish trends. Traders should use this indicator in conjunction with other technical analysis tools to confirm signals and improve overall trade decision-making.
It is particularly useful in markets with consistent price structures, such as forex, stocks, and cryptocurrency markets. Traders should exercise caution during choppy or ranging market conditions, where the indicator's signals might be less reliable, and always combine its insights with robust risk management strategies.
Keep exploring
What we’ve verified
Access, alerts and repainting behaviour have not been independently verified for this indicator. Check the creator’s current publication and settings.
General descriptions and classifications are recovered research. Verified details above identify the specific checks we have completed. Check the creator’s current publication for later changes.