
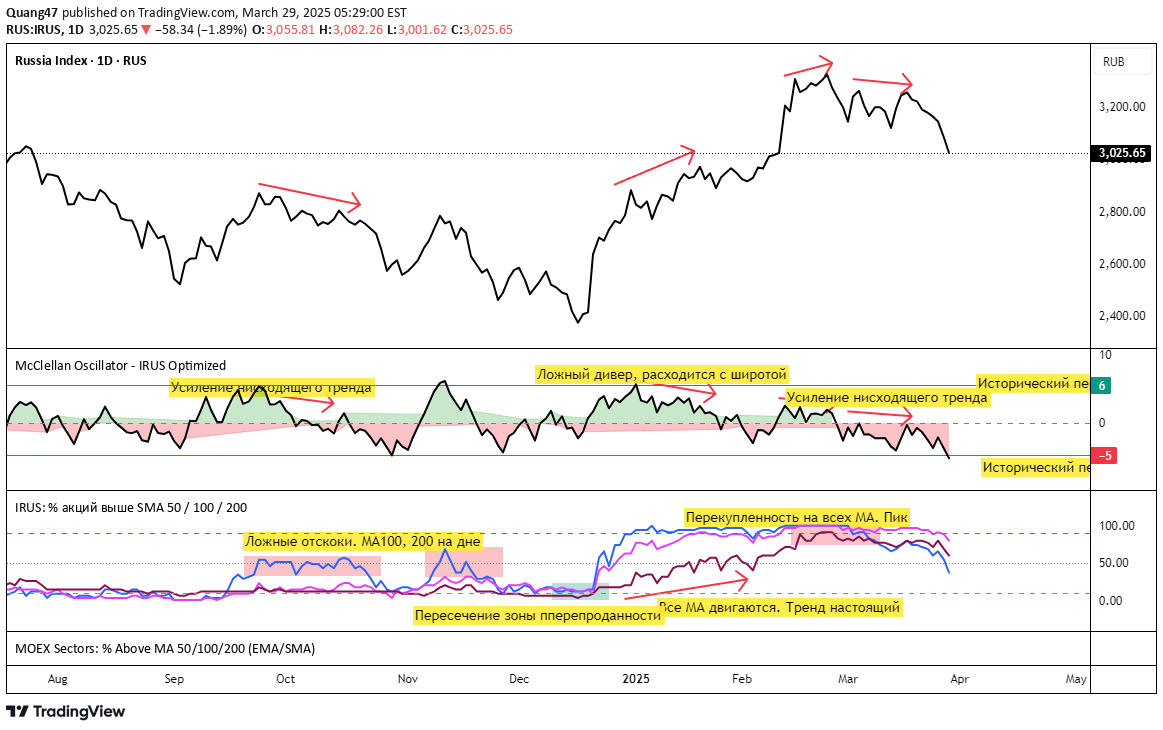
McClellan Oscillator measures market breadth by tracking advancing versus declining stocks within the IRUS index, providing insights into potential trend reversals and market sentiment.
Explore complementary indicator rolesHow it works
The McClellan Oscillator calculates net advances by subtracting the number of declining stocks from advancing stocks within a specific index. It then applies two exponential moving averages (19-day and 39-day) to the net advances, creating an oscillating indicator that reveals market internal dynamics.
By comparing these two moving averages, the oscillator generates values that fluctuate above and below zero, offering traders a quick visual representation of market breadth. Positive values indicate more stocks are rising, suggesting market strength, while negative values suggest underlying weakness in the market's internal structure.
Why it may be useful
The McClellan Oscillator provides traders with a comprehensive view of market sentiment beyond individual stock performance. It helps identify potential trend reversals by measuring the participation and momentum of stocks within an index, offering insights that pure price action might not reveal.
By tracking the broader market's internal strength, traders can make more informed decisions about potential entry and exit points. The oscillator helps detect early warning signs of market shifts, allowing traders to anticipate potential trend changes before they become apparent in price movements.
When to explore it
The McClellan Oscillator works best on daily timeframes and with comprehensive market indices, providing most reliable signals when used in conjunction with other technical analysis tools. It is particularly effective during periods of market transitions, helping traders identify potential oversold or overbought conditions.
Traders should focus on specific signal conditions like oscillator drops below -100 and turning up (potential bullish reversal) or rises above +100 and turning down (potential bearish pullback). The indicator is most valuable when confirming trend strength, detecting divergences, and understanding overall market breadth.
Keep exploring
What we’ve verified
Access, alerts and repainting behaviour have not been independently verified for this indicator. Check the creator’s current publication and settings.
General descriptions and classifications are recovered research. Verified details above identify the specific checks we have completed. Check the creator’s current publication for later changes.


