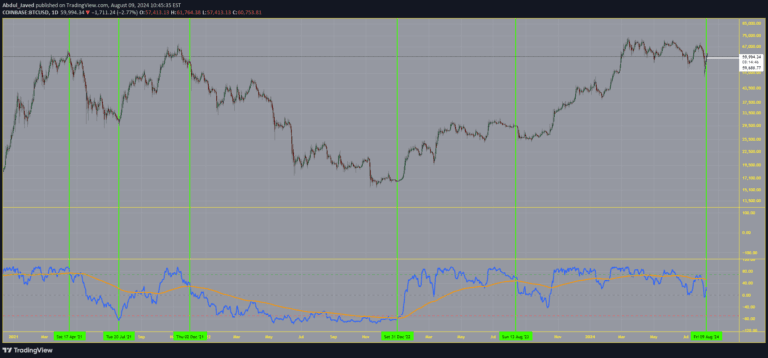
The Old Price Oscillator measures price momentum by calculating the difference between short and long-term moving averages, helping traders identify trend direction and potential trading signals.
Explore complementary indicator rolesHow it works
The Old Price Oscillator calculates momentum by subtracting a longer-term moving average from a shorter-term moving average of a security's price. This difference is plotted as an oscillating line that moves above and below a zero line, creating a visual representation of price momentum and trend strength.
Traders can customize the length of the moving averages to suit specific assets or market conditions. When the oscillator is positive, it suggests upward price momentum, while a negative value indicates downward momentum, helping traders identify potential entry and exit points in the market.
Why it may be useful
The Old Price Oscillator provides traders with a clear visual tool to understand price momentum and trend direction. By smoothing out price fluctuations, it helps traders cut through market noise and identify underlying trends more effectively than raw price data alone.
This indicator is particularly valuable because it can help traders make more informed decisions by quantifying the strength and direction of price movements. It offers insights into potential trend reversals and continuations, allowing traders to develop more strategic entry and exit points in their trading approach.
When to explore it
The Old Price Oscillator works best in markets that exhibit clear, consistent trends, providing reliable signals during strong bullish or bearish market conditions. It is most effective when price movements show clear directional momentum, allowing traders to capitalize on sustained price trends.
However, traders should be cautious about using this indicator in sideways or highly volatile markets, where it may generate less reliable signals. To improve accuracy, it is recommended to combine the Old Price Oscillator with other technical indicators or additional confirmation methods that can help filter out potential false signals.
Keep exploring
What we’ve verified
Access, alerts and repainting behaviour have not been independently verified for this indicator. Check the creator’s current publication and settings.
General descriptions and classifications are recovered research. Verified details above identify the specific checks we have completed. Check the creator’s current publication for later changes.