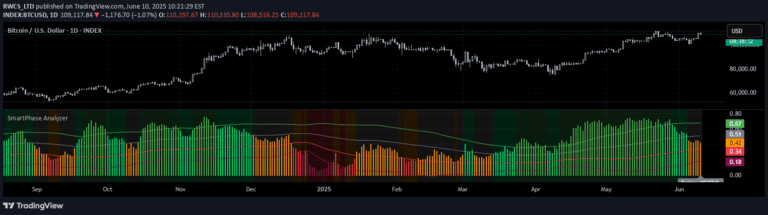
Median of Means is a robust central tendency estimator that reduces the impact of outliers by splitting data into groups and calculating the median of their means.
Explore complementary indicator rolesHow it works
The Median of Means (MoM) technique begins by shuffling a dataset and dividing it into k groups of equal size. For each group, an arithmetic mean is calculated, creating k separate mean values. The final MoM is determined by finding the median of these k group means, which effectively neutralizes the influence of extreme outliers.
This method involves multiple steps of data manipulation to create a more stable and representative central tendency measure. By breaking the dataset into smaller subsets and then taking the median of their means, the approach ensures that no single extreme value can disproportionately skew the overall result.
Why it may be useful
The Median of Means provides traders with a more robust statistical measure that is less sensitive to extreme price fluctuations compared to traditional mean calculations. It offers a more reliable representation of central tendency, especially in financial markets where price data can be highly volatile and contain significant outliers.
By mitigating the impact of extreme values, MoM helps traders make more informed decisions based on a more stable and representative measure of price movement. This approach is particularly valuable in markets with irregular price distributions, where standard mean calculations might lead to misleading interpretations.
When to explore it
Median of Means is most effective when dealing with financial datasets that contain significant outliers or extreme price movements. It is particularly useful in markets with asymmetric price distributions, such as cryptocurrency, emerging market stocks, or during periods of high market volatility.
Traders should consider using MoM when traditional statistical measures fail to provide a clear and reliable picture of price trends. It is especially beneficial in scenarios where a single extreme price point could potentially distort the overall analysis, making it a valuable tool for more nuanced and robust market interpretation.
Keep exploring
What we’ve verified
Access, alerts and repainting behaviour have not been independently verified for this indicator. Check the creator’s current publication and settings.
General descriptions and classifications are recovered research. Verified details above identify the specific checks we have completed. Check the creator’s current publication for later changes.