
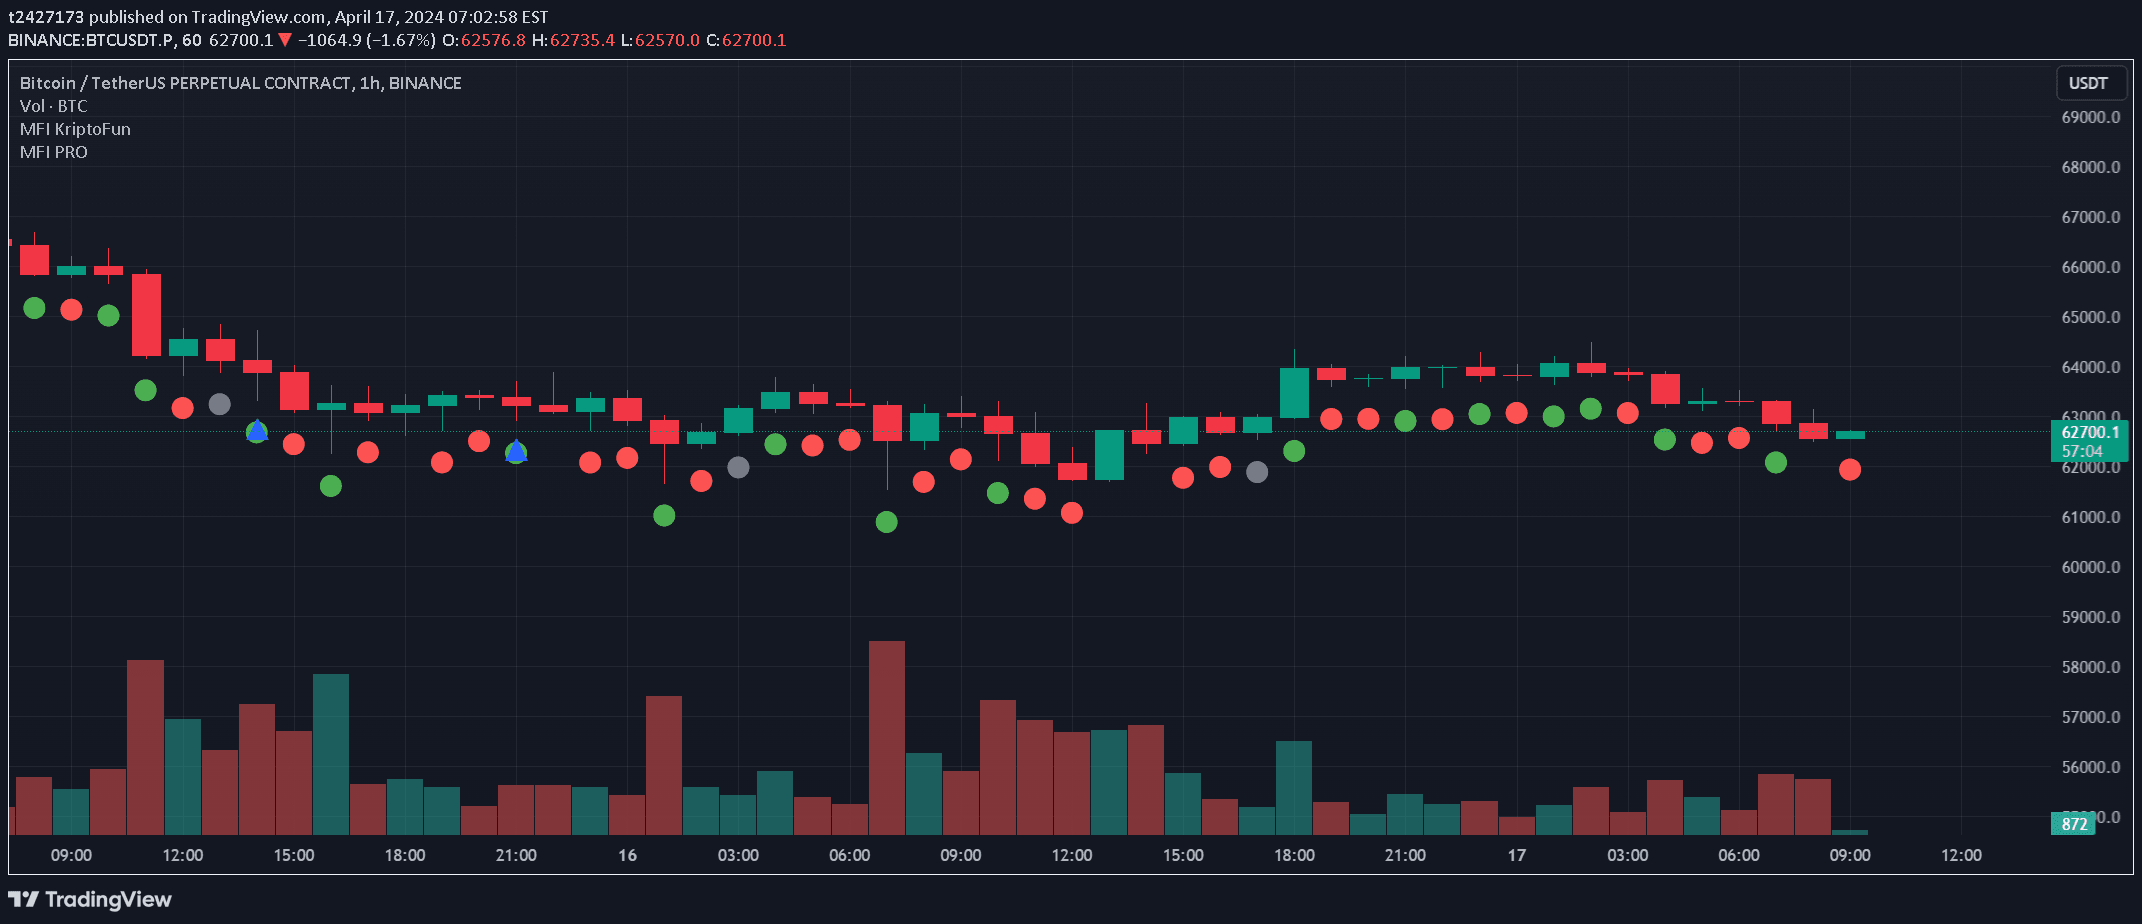
A custom TradingView indicator that plots unique shapes and colors to represent market conditions based on volume and price range changes, helping traders identify potential trading opportunities.
Explore complementary indicator rolesHow it works
The MFI KriptoFun indicator analyzes the relationship between price range and trading volume across consecutive periods. It generates different graphical shapes and colors to represent specific market conditions, with each shape signaling a unique combination of volume and price range changes.
The indicator plots circles and triangles using specific criteria: gray circles indicate decreased volume with increased price range, blue circles show volume increase with price range decrease, green circles represent simultaneous increases in volume and price range, and red circles signal decreases in both volume and price range.
Why it may be useful
This indicator provides traders with a visual representation of market dynamics by translating complex volume and price range data into easily interpretable shapes and colors. By highlighting subtle changes in market behavior, it helps traders quickly identify potential shifts in momentum and trading sentiment.
The MFI KriptoFun serves as a valuable tool for understanding underlying market movements, offering traders an additional layer of insight beyond traditional price charts. Its unique graphical approach allows for rapid assessment of market conditions, potentially revealing trading opportunities that might otherwise go unnoticed.
When to explore it
The MFI KriptoFun indicator is most effective in markets with significant volume fluctuations and clear price range movements. It works best when used in conjunction with other technical analysis tools to confirm potential trading signals and validate market interpretations.
Traders should pay particular attention to the indicator during periods of market transition, such as potential trend reversals or consolidation phases. While powerful, it should not be used in isolation but rather as part of a comprehensive trading strategy that includes multiple confirmation signals and risk management techniques.
Keep exploring
What we’ve verified
Access, alerts and repainting behaviour have not been independently verified for this indicator. Check the creator’s current publication and settings.
General descriptions and classifications are recovered research. Verified details above identify the specific checks we have completed. Check the creator’s current publication for later changes.


