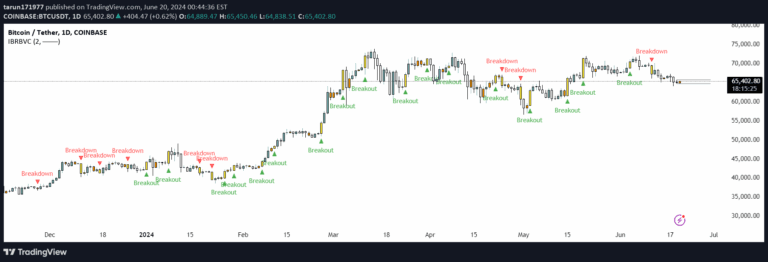
An inside bar pattern represents two consecutive candlesticks where the second candle is contained within the range of the previous candle, signaling potential market consolidation or indecision.
Explore complementary indicator rolesHow it works
The inside bar pattern forms when a smaller candlestick is completely contained within the high and low range of the preceding larger candlestick. This suggests a temporary pause in the current price movement, where market participants are reassessing their positions and waiting for a potential directional breakout. The pattern indicates a compression of price action and potential buildup of market tension.
Traders analyze the inside bar's location relative to the previous trend and the subsequent price action to determine potential trading signals. The parent candle's size, direction, and context are crucial in interpreting the pattern's potential meaning. A breakout from the inside bar's range can signal the next potential price movement direction.
Why it may be useful
The inside bar pattern provides traders with valuable insights into market psychology and potential trend reversals or continuations. It helps identify periods of consolidation where market participants are temporarily uncertain, which can precede significant price movements. By recognizing these moments of indecision, traders can prepare for potential breakout scenarios and manage their risk more effectively.
Understanding the inside bar pattern allows traders to develop more nuanced entry and exit strategies. It offers a visual representation of market sentiment, helping traders gauge potential momentum shifts and make more informed trading decisions across different timeframes and market conditions.
When to explore it
The inside bar pattern is most effective when used in conjunction with other technical analysis tools and within a clear market context. It works best in trending markets where the pattern can signal potential continuation or reversal signals. Traders should look for inside bars that form after a strong trending move, as these are more likely to indicate meaningful market developments.
The pattern is particularly useful in volatile markets with clear directional movements. Traders should pay attention to the size and location of the inside bar relative to previous price action, as well as confirming signals from momentum indicators or support/resistance levels. It can be applied across various financial instruments and timeframes, making it a versatile tool for different trading strategies.
Keep exploring
What we’ve verified
Access, alerts and repainting behaviour have not been independently verified for this indicator. Check the creator’s current publication and settings.
General descriptions and classifications are recovered research. Verified details above identify the specific checks we have completed. Check the creator’s current publication for later changes.