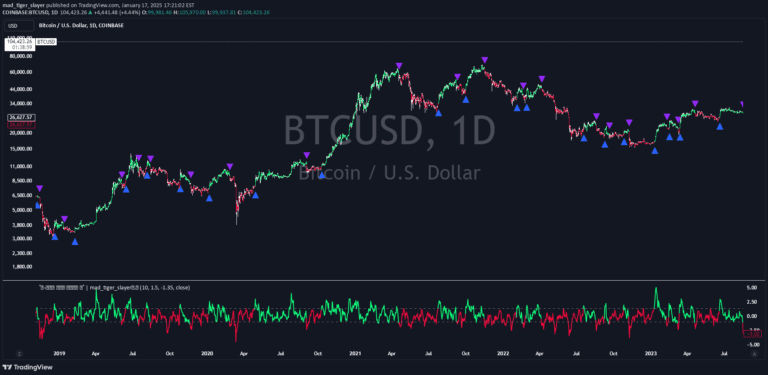
A trading bot using MACD and RSI indicators to generate buy and sell signals by analyzing price momentum and potential market turning points.
Explore complementary indicator rolesHow it works
The trading bot leverages two key technical indicators: Moving Average Convergence Divergence (MACD) and Relative Strength Index (RSI) to generate trading signals. It first identifies MACD crossovers between 7-day and 25-day moving average lines, which indicate potential changes in market momentum and trend direction.
After detecting a MACD crossover, the bot applies an additional RSI filter to confirm the signal's validity. When a crossover occurs, it checks the RSI value to determine whether to generate a buy or sell signal. A buy signal is triggered when the RSI is below 40, suggesting an undervalued market condition, while a sell signal is generated when the RSI is above 60, indicating a potentially overvalued market.
Why it may be useful
Technical indicators like MACD and RSI provide traders with valuable insights into market momentum, trend strength, and potential reversal points. By combining these indicators, traders can make more informed decisions about market entry and exit points, reducing the likelihood of trading based on emotion or random market noise.
The bot's approach helps traders identify potential trading opportunities by using mathematical calculations and historical price data. This systematic method allows for a more disciplined and objective approach to trading, which can help mitigate risks and improve overall trading strategy performance.
When to explore it
This trading signal strategy is most effective in markets with clear trending behavior and moderate volatility. It works best when price movements show consistent momentum and when there are distinct trends that can be captured by the MACD and RSI indicators.
Traders should consider using this signal during periods of stable market conditions, such as in trending markets or during less volatile trading sessions. It is particularly useful for day trading and swing trading strategies, where capturing medium-term price movements can be more predictable than in extremely volatile or ranging markets.
Keep exploring
What we’ve verified
Access, alerts and repainting behaviour have not been independently verified for this indicator. Check the creator’s current publication and settings.
General descriptions and classifications are recovered research. Verified details above identify the specific checks we have completed. Check the creator’s current publication for later changes.