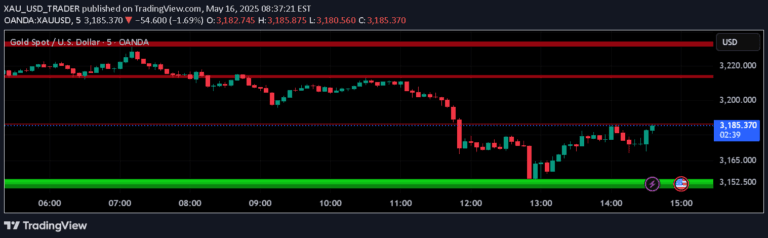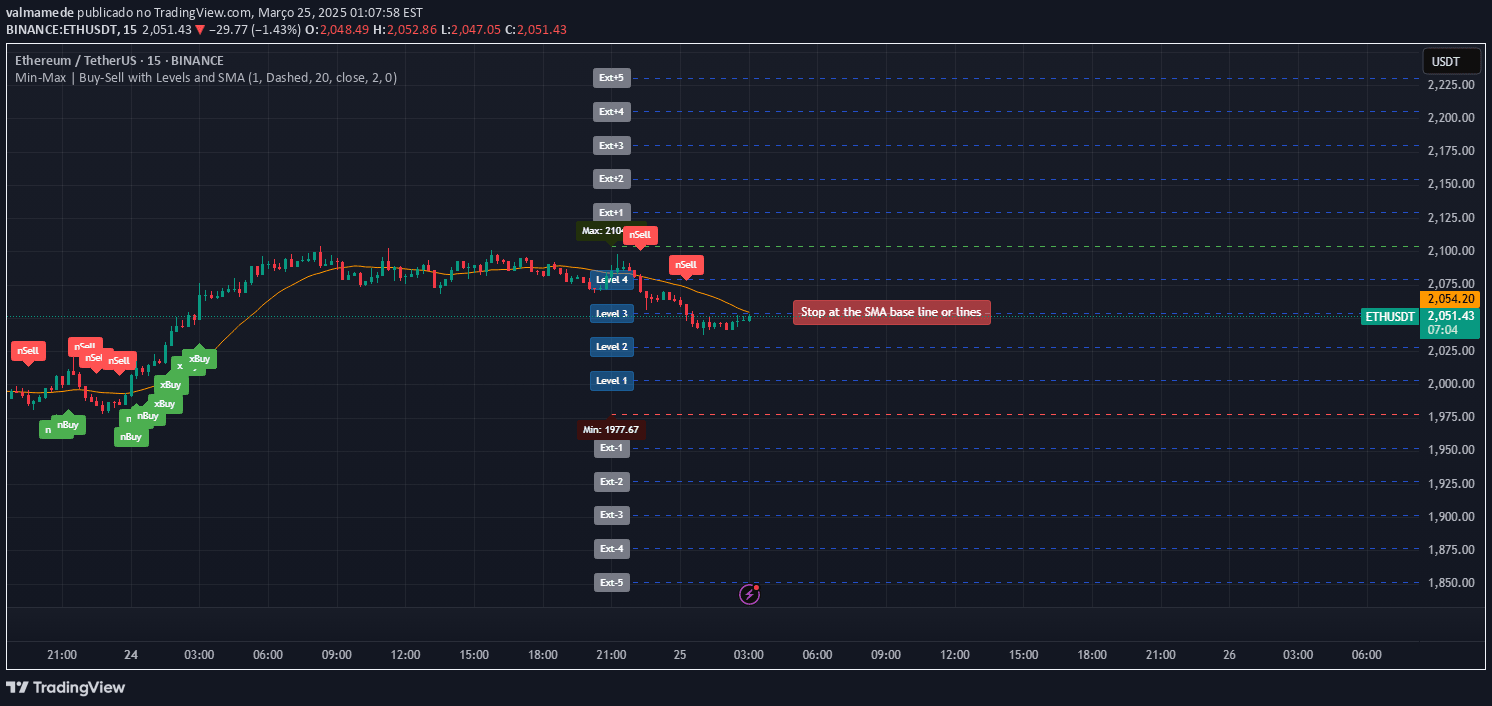
A dynamic trading indicator that plots previous day's min and max price levels with intermediate stop-loss zones, helping traders identify key support and resistance areas with customizable alerts.
Explore complementary indicator rolesHow it works
The Min-Max indicator analyzes the previous trading day's price action by identifying the lowest and highest price points. It automatically plots these points as horizontal lines representing support and resistance zones.
Additionally, it calculates and displays four equally spaced intermediate stop-loss levels between the minimum and maximum prices. The indicator dynamically updates these lines for each new trading day, providing traders with a visual representation of potential entry, exit, and stop-loss points based on recent price movement
Why it may be useful
This indicator is crucial for traders seeking structured price level analysis and risk management. By highlighting key support and resistance zones, it helps traders make more informed decisions about potential entry and exit points.
The intermediate stop-loss levels provide a systematic approach to managing trade risk and protecting capital. The customizable alert system ensures traders never miss critical price movement opportunities, making it easier to execute trades with greater precision and confidence
When to explore it
The Min-Max indicator works best in markets with clear daily price ranges and moderate volatility. It is particularly effective for day traders and swing traders who want to capitalize on price reversals and breakouts.
Traders should use this indicator when seeking structured entry and exit points based on recent price history. It is most reliable in liquid markets with consistent trading volumes, such as major stock indices, forex pairs, and heavily traded commodities
Keep exploring
What we’ve verified
Access, alerts and repainting behaviour have not been independently verified for this indicator. Check the creator’s current publication and settings.
General descriptions and classifications are recovered research. Verified details above identify the specific checks we have completed. Check the creator’s current publication for later changes.