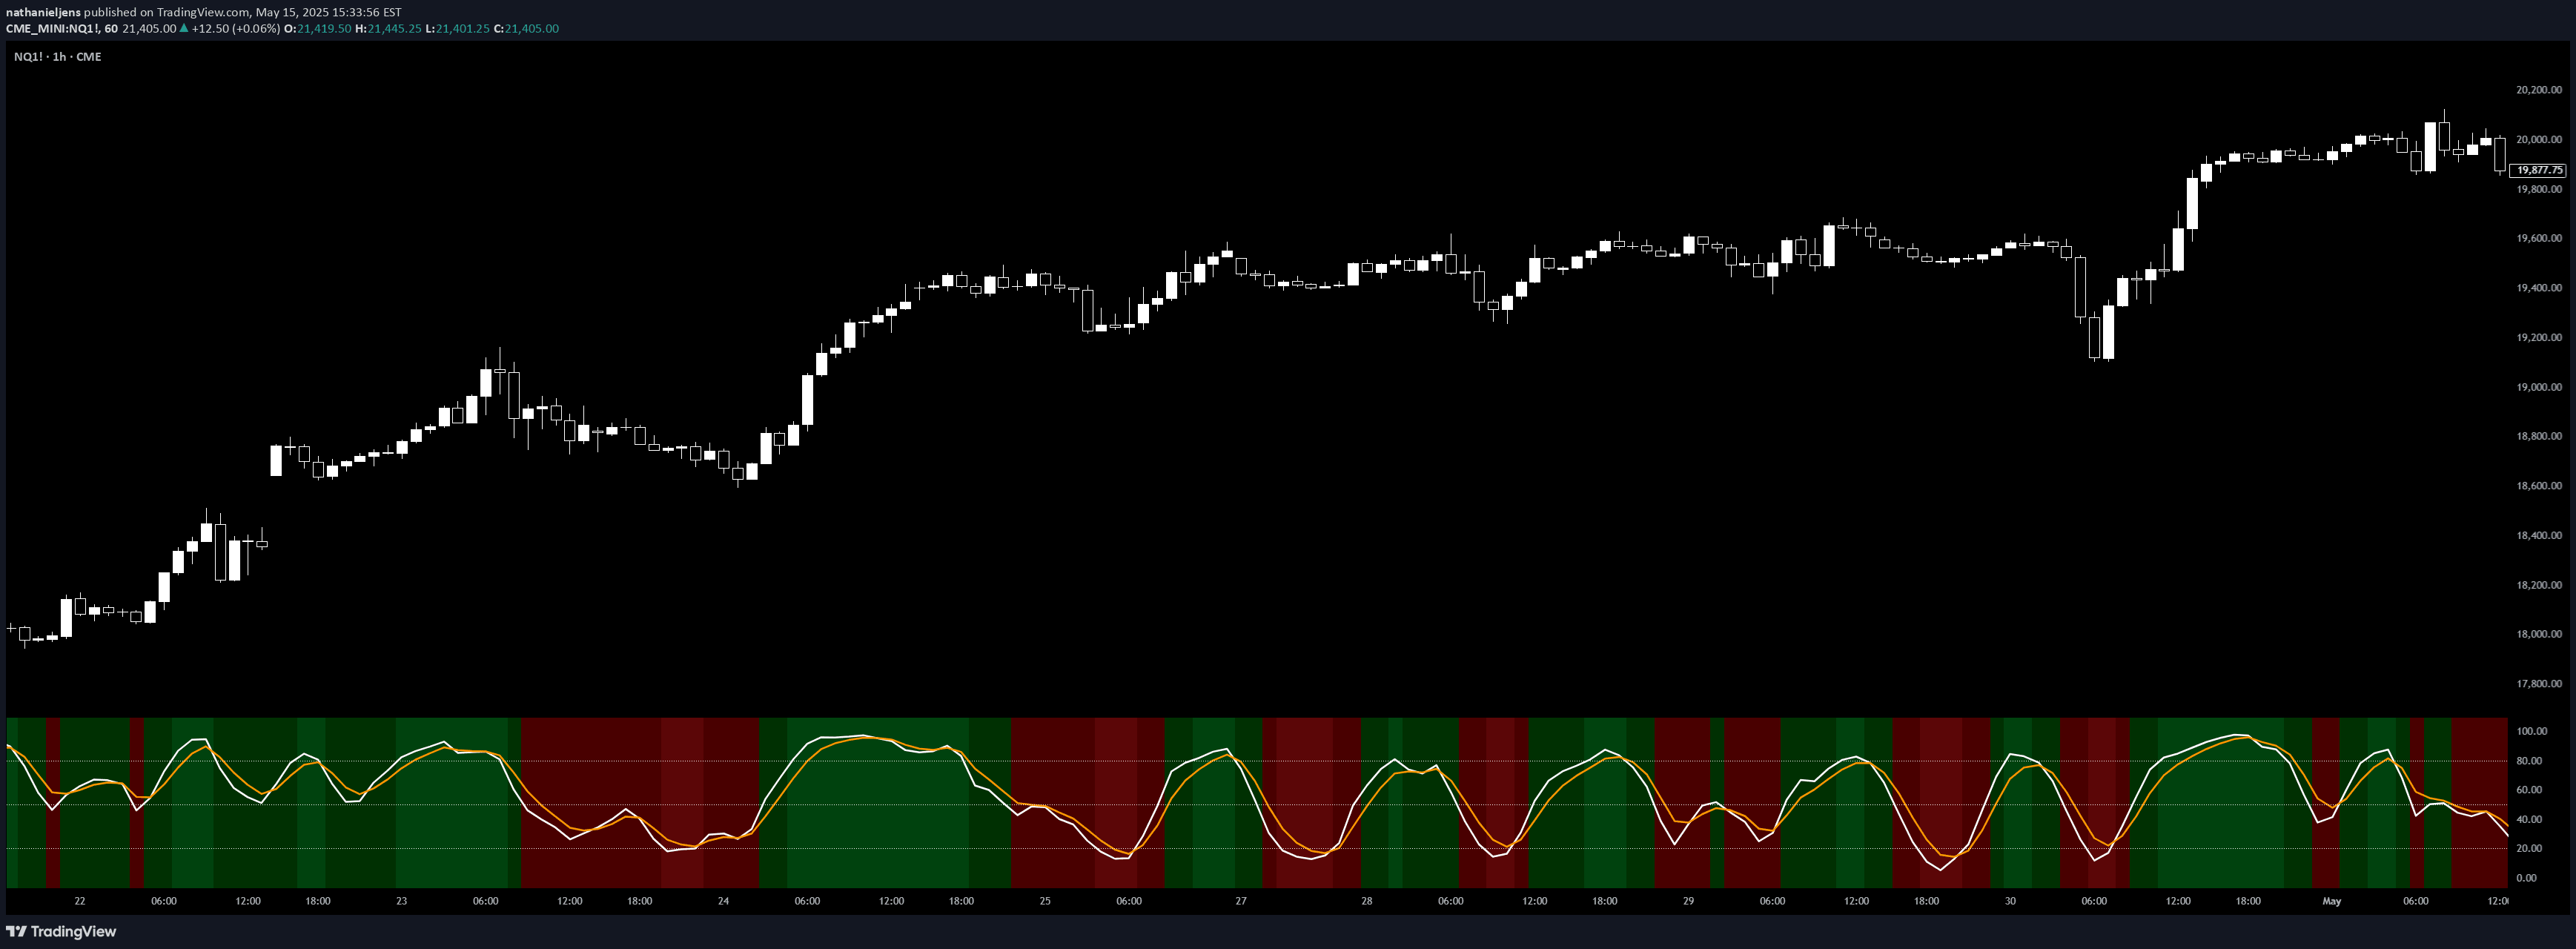
A trend-following oscillator that normalizes candle data within a configurable lookback period, converting price movements into a 0-100 scale to identify market direction.
Explore complementary indicator rolesHow it works
The script analyzes a defined period of recent candles to discover their minimum and maximum values. It then normalizes all values within that period to a 0-100 range, creating a standardized representation of price movement. The indicator calculates an average from Open, High, Low, and Close prices, which helps smooth out market volatility and provide a more stable trend indication.
By mapping price data to this normalized scale, the indicator can quickly show whether current price action is trending upward or downward. When prices are consistently near the top of the range (close to 100), it suggests a strong uptrend, while prices near the bottom (close to 0) indicate a developing downtrend.
Why it may be useful
This indicator provides traders with a clear, normalized view of market momentum that cuts through the noise of price fluctuations. By converting complex price data into a simple 0-100 scale, it makes trend identification more intuitive and accessible, especially for traders who struggle with interpreting raw price charts.
The smoothing technique helps reduce the impact of short-term volatility, offering a more stable trend perspective. The configurable thresholds allow traders to customize the indicator to their specific trading style and risk tolerance. By defining custom bullish and bearish levels, traders can create personalized signals that align with their unique market interpretation and trading strategy.
When to explore it
The indicator is most effective on higher timeframes like daily charts, where longer-term trends become more apparent and short-term noise is minimized. It works particularly well for cryptocurrencies like Bitcoin, where trend identification can be challenging due to high market volatility. Traders can apply this tool across various financial instruments, adjusting the lookback period to suit different market conditions and trading styles.
For optimal results, traders should combine this indicator with other technical analysis tools to confirm signals and reduce false positives. It's especially useful during trending market conditions, where clear directional movement can be identified and leveraged. The versatility of the indicator makes it suitable for multiple trading approaches, from quick scalping to longer-term swing trading strategies.
Keep exploring
What we’ve verified
Access, alerts and repainting behaviour have not been independently verified for this indicator. Check the creator’s current publication and settings.
General descriptions and classifications are recovered research. Verified details above identify the specific checks we have completed. Check the creator’s current publication for later changes.