A market trend indicator that tracks multiple sector symbols to help traders identify market direction and potential trend days using a visual dot-based map.
Explore complementary indicator rolesHow it works
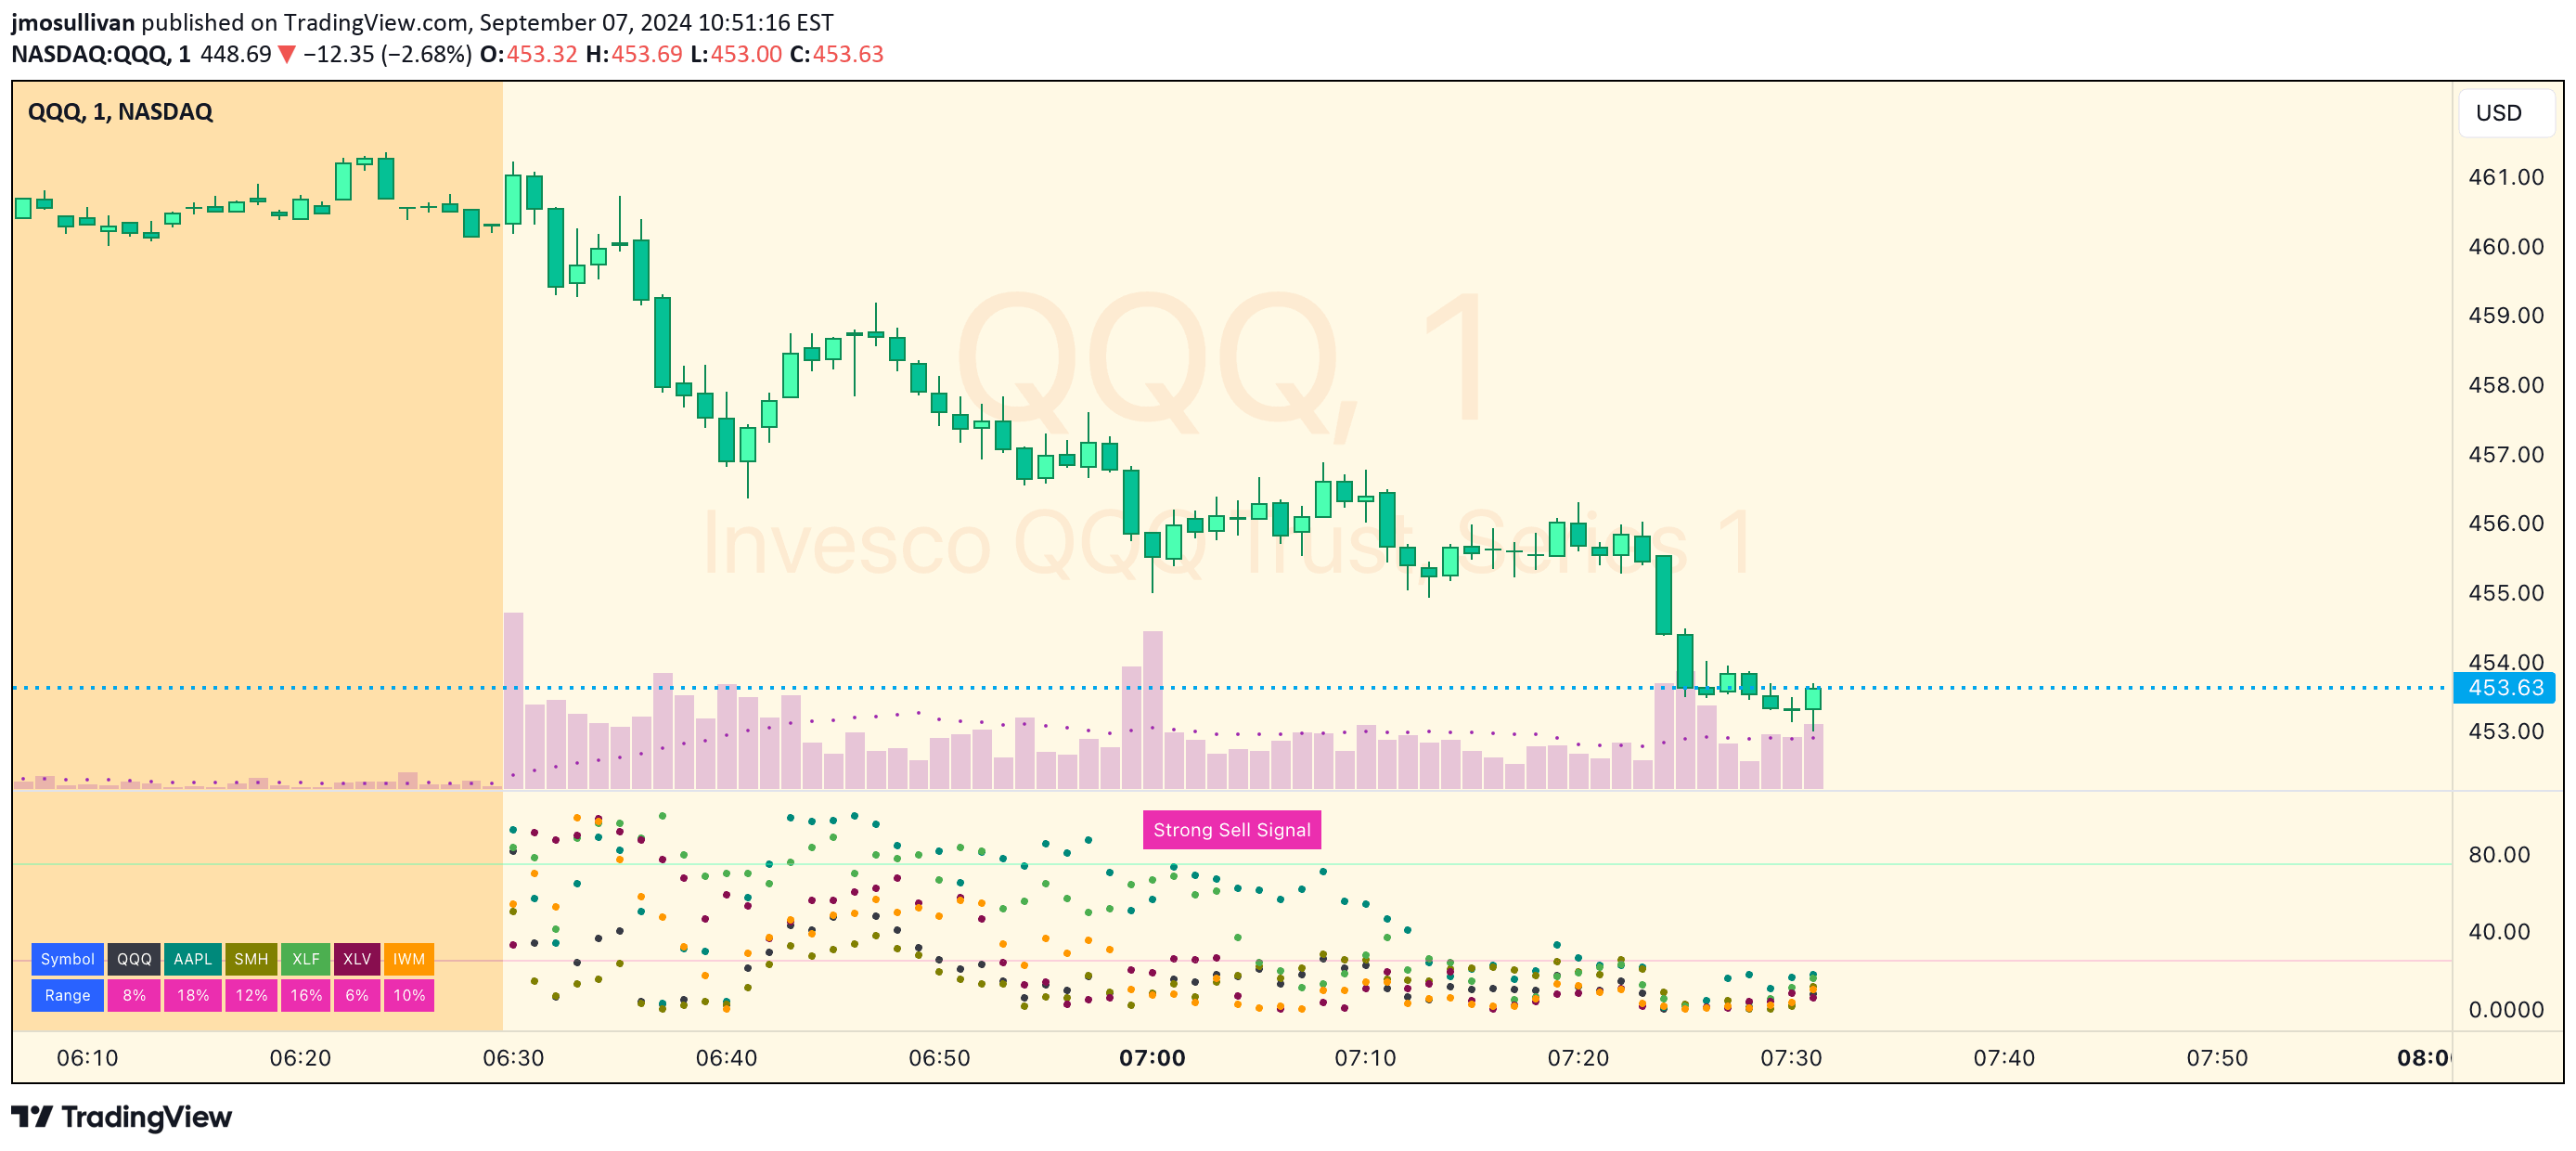
The script analyzes six key market symbols representing technology and broader market sectors: QQQ, SMH, NVDA, XLF, XLV, and IWM. It tracks each symbol's price position within its daily trading range, creating a comprehensive view of market movement.
By presenting data in both a table and a dot-based map, the indicator allows traders to quickly visualize how different market sectors are performing. The map shows where each symbol is positioned relative to its daily high and low, providing an instant snapshot of market sentiment and potential trend direction.
Why it may be useful
This indicator offers a unique perspective on market movement by focusing on current-day price positioning rather than traditional percentage change metrics. It helps traders understand market sentiment in real-time, providing insights into potential trend development beyond typical lagging indicators.
By showing how different market sectors are moving simultaneously, traders can make more informed decisions about market direction. The visual representation allows for quick interpretation of complex market dynamics, potentially revealing emerging trends before they become widely apparent.
When to explore it
This signal is most effective during active trading sessions when multiple market sectors are showing clear directional movement. It is particularly useful for day traders and scalpers who need rapid insights into market sentiment and potential trend development.
Traders should use this indicator when seeking to confirm market-wide momentum and understand the collective behavior of different market sectors. It is especially valuable during periods of potential market trending, helping traders align their strategies with broader market movements.
Keep exploring
What we’ve verified
Access, alerts and repainting behaviour have not been independently verified for this indicator. Check the creator’s current publication and settings.
General descriptions and classifications are recovered research. Verified details above identify the specific checks we have completed. Check the creator’s current publication for later changes.