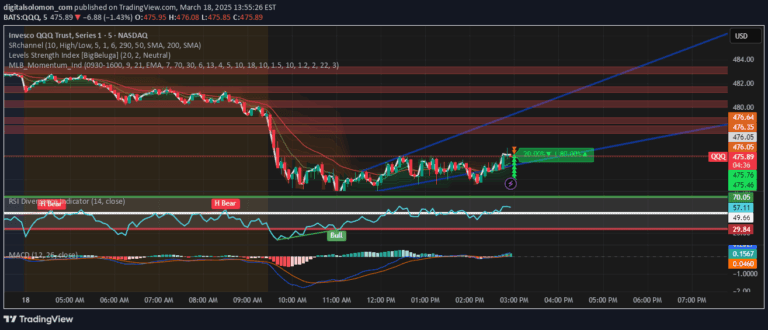
The Momentum Memory Indicator predicts future price movements by analyzing historical momentum using Rate of Change and averaging techniques across specified time periods.
Explore complementary indicator rolesHow it works
The Momentum Memory Indicator calculates momentum by measuring the Rate of Change (ROC) over a specified period, typically 14 periods. It first computes how much the price has changed relative to a previous closing price, providing a raw momentum measurement that indicates the asset's current price velocity.
After calculating the ROC, the indicator applies a simple moving average (SMA) over a memory period, usually 5 periods, to smooth out the momentum data. This averaged momentum is then used to predict potential future price movements by adjusting the current closing price, creating a histogram that visually represents the expected price direction and magnitude.
Why it may be useful
The Momentum Memory Indicator helps traders understand underlying market dynamics by transforming raw price movement data into a more interpretable format. By measuring and averaging momentum, it provides insights into potential future price trends, allowing traders to make more informed decisions about market direction and potential entry or exit points.
Unlike many static indicators, this tool offers a dynamic perspective on market momentum, capturing both recent and slightly older price movement patterns. Its color-coded histogram makes it easy to quickly assess market sentiment, with green indicating positive momentum and red signaling potential downward pressure.
When to explore it
The Momentum Memory Indicator is most effective in markets with clear trending characteristics, where price movements demonstrate consistent directional momentum. It performs particularly well in markets with moderate volatility, where price changes are significant enough to generate meaningful momentum signals but not so erratic that they become unpredictable.
Traders should use this indicator in conjunction with other technical analysis tools to confirm signals and reduce false positives. It is especially useful for identifying potential trend continuations, detecting early signs of momentum shifts, and providing visual confirmation of emerging market movements across various timeframes.
Keep exploring
What we’ve verified
Access, alerts and repainting behaviour have not been independently verified for this indicator. Check the creator’s current publication and settings.
General descriptions and classifications are recovered research. Verified details above identify the specific checks we have completed. Check the creator’s current publication for later changes.