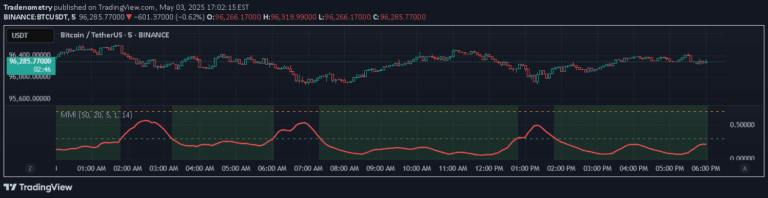
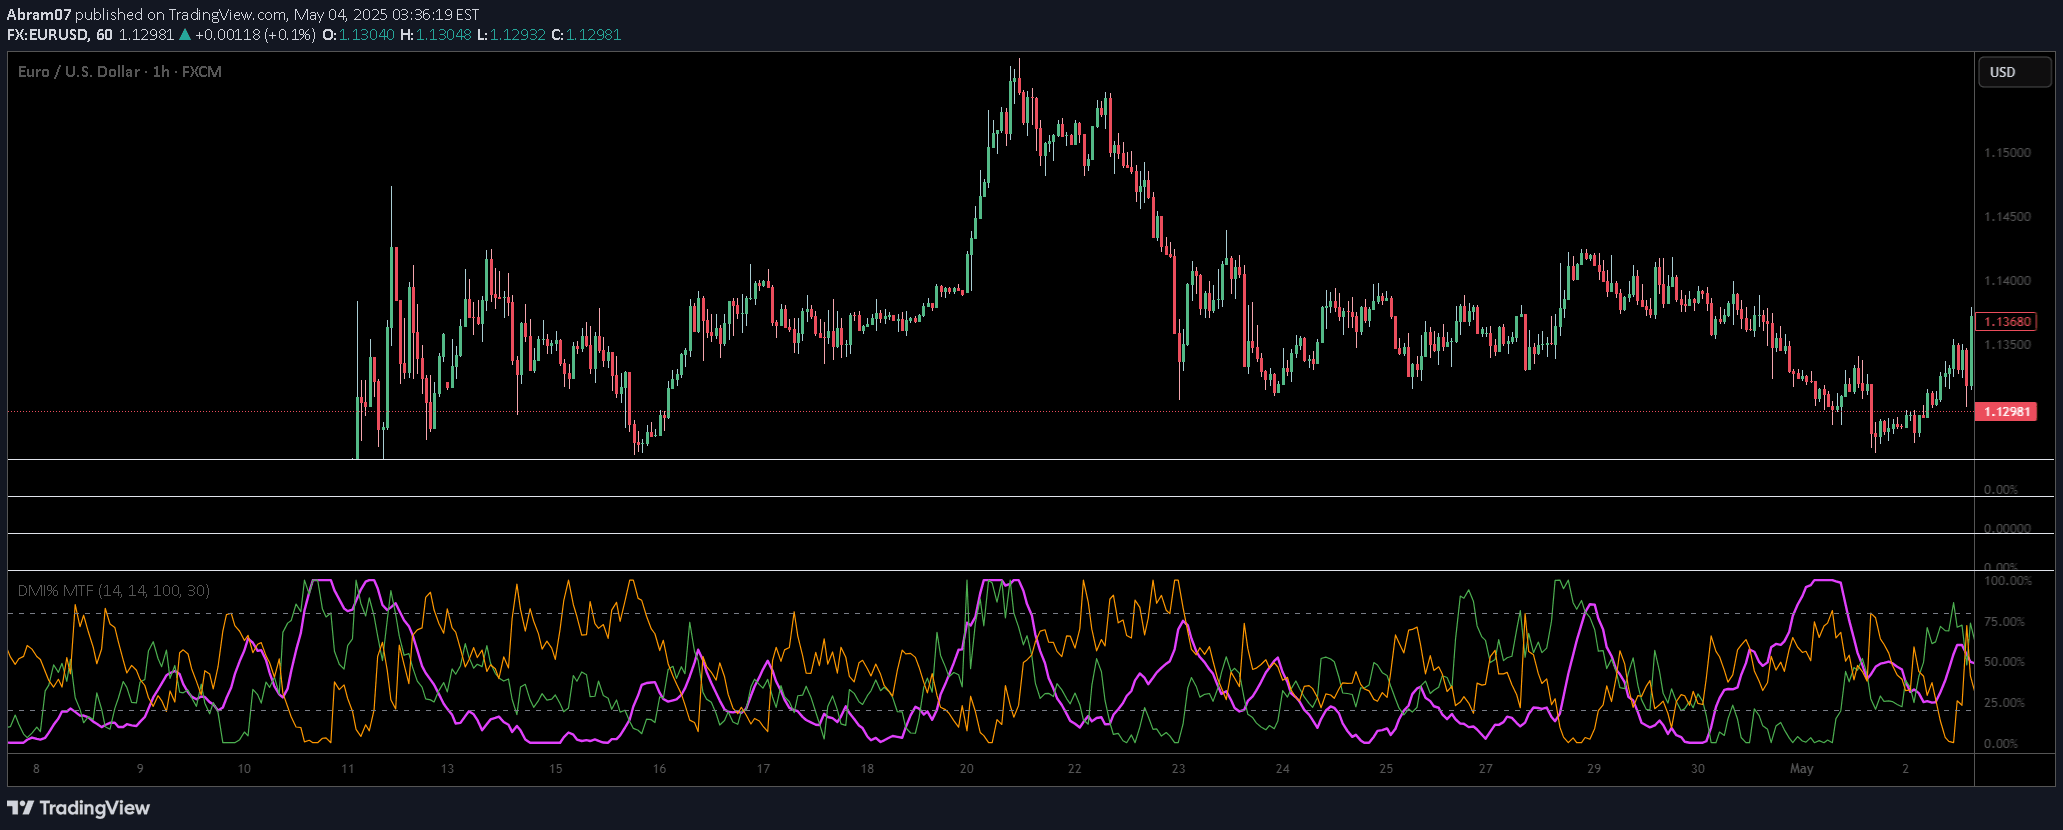
Moonhub Cycle Index combines MACD, STC, and DPO to create a comprehensive market trend and sentiment analysis tool for traders seeking multi-indicator insights.
Explore complementary indicator rolesHow it works
The Moonhub Cycle Index operates by integrating three distinct technical analysis indicators to generate a comprehensive market perspective. It first calculates the MACD by measuring the difference between 12-period and 26-period exponential moving averages, then applies a 9-period signal line. Simultaneously, it computes the Schaff Trend Cycle using a stochastic oscillator formula over a 10-period window.
The Detrended Price Oscillator is then calculated by shifting price data and subtracting the simple moving average to eliminate trend components. These three indicators are averaged to create a custom composite index, which provides a nuanced view of market dynamics and potential trend directions.
Why it may be useful
The Moonhub Cycle Index offers traders a sophisticated, multi-dimensional approach to market analysis by combining different technical indicators into a single comprehensive tool. By integrating momentum, trend, and cycle indicators, it provides a more robust and reliable signal than single-indicator methods, helping traders make more informed decisions.
This composite approach reduces the likelihood of false signals and helps traders identify potential market trends with greater confidence. The index's ability to smooth out market noise and provide a holistic view makes it particularly valuable for traders seeking a more comprehensive understanding of market movements and potential trading opportunities.
When to explore it
The Moonhub Cycle Index is most effective in markets with clear trending characteristics, where multiple technical indicators can provide complementary insights. It performs particularly well in liquid markets with sufficient price movement, such as major stock indices, forex pairs, and actively traded commodities.
Traders should apply this indicator during periods of moderate to high market volatility, where its multi-indicator approach can help identify potential trend reversals and momentum shifts. It is especially useful when combined with other confirmatory technical and fundamental analysis tools to validate trading signals and minimize potential false readings.
Keep exploring
What we’ve verified
Access, alerts and repainting behaviour have not been independently verified for this indicator. Check the creator’s current publication and settings.
General descriptions and classifications are recovered research. Verified details above identify the specific checks we have completed. Check the creator’s current publication for later changes.