
YOUR INDICATOR RESEARCH STARTS HERE

Find the right indicator.
Understand what it does.

Explore 11,183 indicators. Filter beyond the obvious.
Discover the tools that fit the way you trade.

THE INDICATOR LIBRARY

Results for “STC”

11,183 tools to explore

17 indicators matching your filters
Save search
VolumeTrendEditor’s pick

Developing Market Profile / TPO [Honestcowboy]

by Honestcowboy

A dynamic Market Profile indicator that visualizes price distribution across time, showing how price moves through different zones and helping traders understand market behavior and potential trading opportunities.

Main price chart · unverifiedDay Trading · Swing Trading
Explore
881likes52.9Kviews20comments
Save
TrendMomentumEditor’s pick

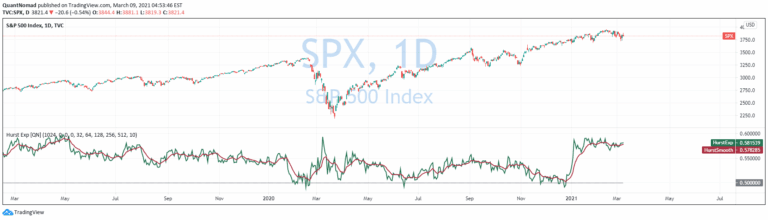
Hurst Exponent

by QuantNomad

The Hurst Exponent is a statistical measure that evaluates time series behavior, helping traders identify market trends, mean reversion, and potential future price movements.

Separate pane · unverifiedDay Trading · Swing Trading
Explore
861likes26.4Kviews10comments
Save
LevelsPatternsSignal

Fractals Pivots

by Honestcowboy

Fractal Pivots are a unique technical analysis method using Bill Williams' Fractal Theory to identify repetitive price patterns and generate pivot lines across different timeframes.

Main price chart · unverifiedScalping · Day Trading
Explore
281likes10Kviews1comments
Save
LevelsSignal

First Candle High Low Levels

by jairuvi12

A Pine Script indicator that marks the high and low of the first daily candle, providing visual reference for traders in the Indian stock market during specific trading hours.

Main price chart · unverifiedScalping · Day Trading
Explore
239likes7.4Kviews10comments
Save
OscillatorSignalTrend

Harmonic Sine Waves model plot

by bartekhl

A signal generator creating complex sine wave patterns by combining base sine wave with its harmonics, demonstrating how simplified models can represent intricate market movements.

Separate pane · unverifiedScalping · Day Trading
Explore
159likes6Kviews7comments
Save
TrendSignal

First Candle

by samscripter

A trading strategy that identifies and trades breakouts based on the first candle of the day's high and low. It aims to capture early directional price movements.

Main price chart · unverifiedScalping · Day Trading
Explore
126likes3.4Kviews0comments
Save
TrendVolatilitySignal

Sizeblock

by StCogitans

A price change indicator using diagonal rows to track price movement deviations, helping traders visualize trend direction and potential reversal points.

Main price chart · unverifiedScalping · Day Trading
Explore
120likes3Kviews3comments
Save
MomentumOscillatorTrend

Moonhub Cycle Index

by Moonhub

Moonhub Cycle Index combines MACD, STC, and DPO to create a comprehensive market trend and sentiment analysis tool for traders seeking multi-indicator insights.

Separate pane · unverifiedScalping · Day Trading
Explore
103likes4.9Kviews1comments
Save

Likes, views, and comments are historical TradingView snapshots. They describe attention, not trading performance.

START WITH A QUESTION

A little less searching.
A lot more understanding.

Tell DeepAlpha what you need. Get an explanation, a shortlist,
and a direct path to the indicators behind it.

Ask DeepAlpha