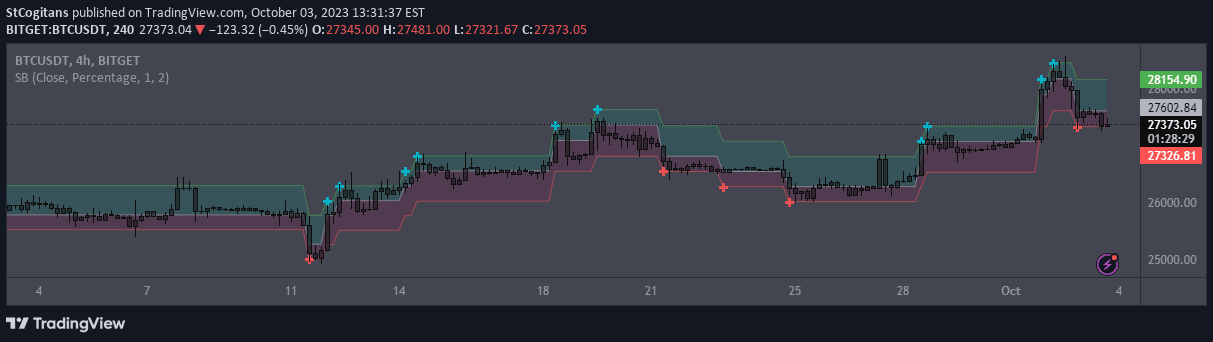
A price change indicator using diagonal rows to track price movement deviations, helping traders visualize trend direction and potential reversal points.
Explore complementary indicator rolesHow it works
The indicator calculates price movement using percentage or tick deviation, creating diagonal rows with a base middle line and upper and lower limits. The base middle line dynamically adjusts based on previous row limits, tracking price changes across different chart intervals.
When the price reaches or exceeds the row's upper or lower limits, a new row is formed with the same deviation parameters. The 'Source' parameter allows selection of high, low, or closing prices for calculation, providing flexibility in tracking price movements.
Why it may be useful
This indicator helps traders identify local trends and potential reversal points by visualizing price movements through a unique diagonal row system. It provides a clear, dynamic representation of price changes, allowing traders to quickly understand market direction and momentum.
By offering a flexible approach to tracking price movement, the indicator can help traders make more informed decisions about entry and exit points, adaptable to various market conditions and trading styles.
When to explore it
The indicator is most effective in markets with clear directional movements and when traders want to identify trend strength and potential reversal points. It works well across different timeframes, from short-term scalping to longer-term swing trading, making it versatile for various trading strategies.
Traders should use this indicator in conjunction with other technical analysis tools to confirm signals and reduce false positives. It is particularly useful in volatile markets where quick identification of trend changes can provide a significant trading advantage.
Keep exploring
What we’ve verified
Access, alerts and repainting behaviour have not been independently verified for this indicator. Check the creator’s current publication and settings.
General descriptions and classifications are recovered research. Verified details above identify the specific checks we have completed. Check the creator’s current publication for later changes.