
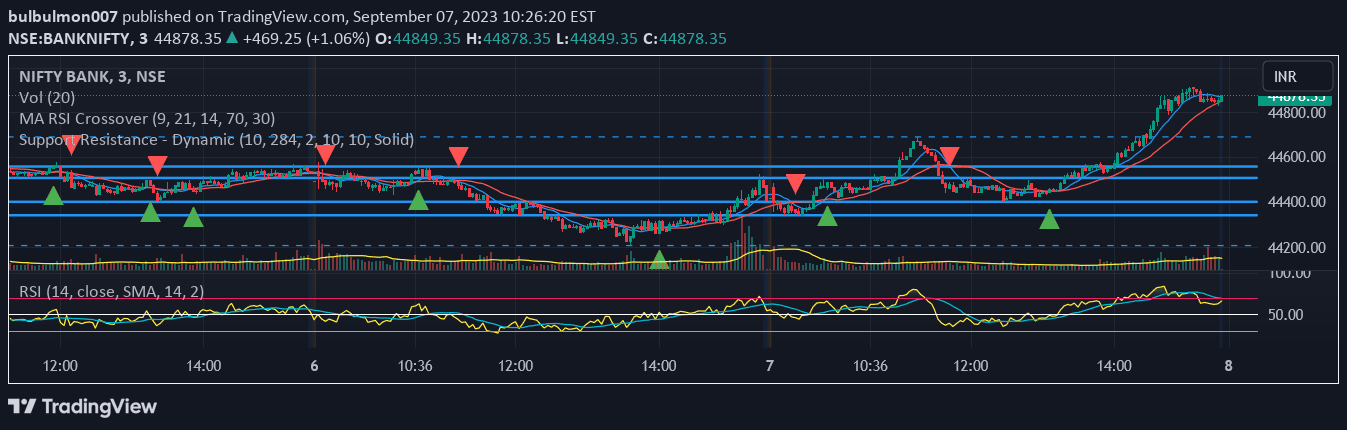
A trading strategy focusing on buy and sell signals derived from support and resistance levels, combined with RSI bull or bear crossover analysis for market entry and exit points.
Explore complementary indicator rolesHow it works
The signal strategy begins by identifying key support and resistance levels on a price chart, which serve as critical boundary points for potential market movements. Traders then incorporate the Relative Strength Index (RSI) to analyze momentum through bull and bear crossovers, which help confirm potential trend reversals or continuations.
When the price approaches support or resistance levels, traders watch for RSI crossovers as additional confirmation of potential trade entry or exit points. The RSI helps validate whether the market momentum supports the anticipated price movement, providing a more robust decision-making framework for traders seeking precise entry and exit strategies.
Why it may be useful
This trading signal combines multiple technical analysis tools to provide a more comprehensive view of market dynamics, reducing the likelihood of false signals and improving trade accuracy. By integrating support and resistance levels with RSI momentum analysis, traders can make more informed decisions about market trends and potential price movements.
The approach offers traders a structured method to identify high-probability trading opportunities, balancing technical indicators with price action insights. It helps traders manage risk by providing clear entry and exit criteria based on both price levels and momentum indicators, ultimately enhancing overall trading strategy and potential profitability.
When to explore it
This signal strategy works best in markets with clear trending or range-bound conditions, where support and resistance levels are well-defined and RSI can effectively measure momentum shifts. Traders should apply this method in liquid markets with sufficient price action, such as major forex pairs, stock indices, or highly traded commodities.
The signal is particularly effective during periods of moderate market volatility, where price movements are consistent enough to generate reliable signals. Traders should be cautious during extreme market conditions or low-liquidity periods, as these can produce less reliable technical indicator readings and potentially lead to false signal generation.
Keep exploring
What we’ve verified
Access, alerts and repainting behaviour have not been independently verified for this indicator. Check the creator’s current publication and settings.
General descriptions and classifications are recovered research. Verified details above identify the specific checks we have completed. Check the creator’s current publication for later changes.


