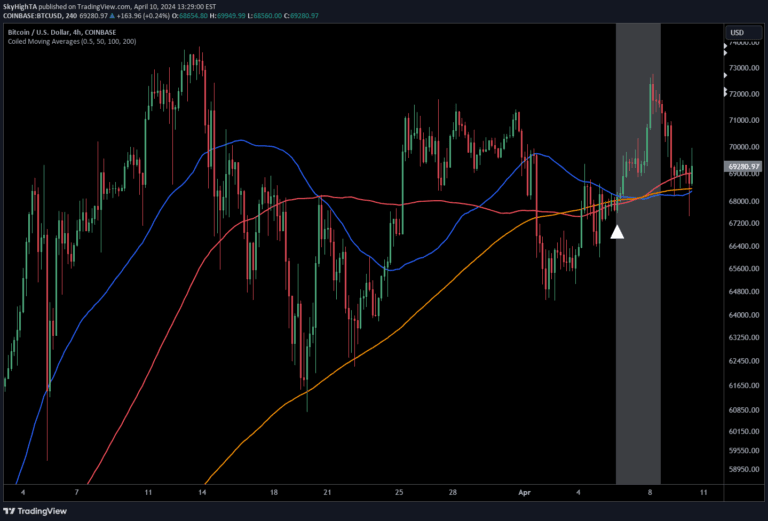
A specialized candlestick overlay that replaces traditional price candles with smoothed versions using various moving average techniques to reduce market noise and clarify price structure.
Explore complementary indicator rolesHow it works
The Moving Average Candles script transforms traditional price candles by independently smoothing each OHLC (Open, High, Low, Close) component using selected moving average methods. Traders can choose from 13 different moving average types, including SMA, EMA, RMA, and others, with configurable lengths ranging from 1 to 1000.
By applying moving averages to each price component, the script creates a new representation of candlesticks that filters out short-term market noise. The resulting candles are color-coded based on the smoothed Open and Close values, providing a clearer visual interpretation of market structure and trend dynamics.
Why it may be useful
Traditional price candles can be cluttered with random market fluctuations that obscure underlying trends and make analysis challenging. By smoothing each price component, traders gain a more refined view of market movement, reducing the impact of short-term volatility and noise.
The ability to choose from multiple moving average types allows traders to customize their analysis approach, adapting the smoothing technique to different market conditions and trading styles. This flexibility enables more nuanced trend identification and potentially more reliable visual trend representation.
When to explore it
The Moving Average Candles technique is most effective in markets with established trends where reducing noise can provide clearer directional insights. It works particularly well in ranging and trending markets across multiple timeframes, helping traders identify smoother price progression and potential trend changes.
Traders should use this overlay in conjunction with other technical analysis tools to confirm signals and avoid making trading decisions based solely on the smoothed candles. It is especially useful for traders seeking a cleaner visual representation of price dynamics and wanting to understand underlying market structure more effectively.
Keep exploring
What we’ve verified
Access, alerts and repainting behaviour have not been independently verified for this indicator. Check the creator’s current publication and settings.
General descriptions and classifications are recovered research. Verified details above identify the specific checks we have completed. Check the creator’s current publication for later changes.