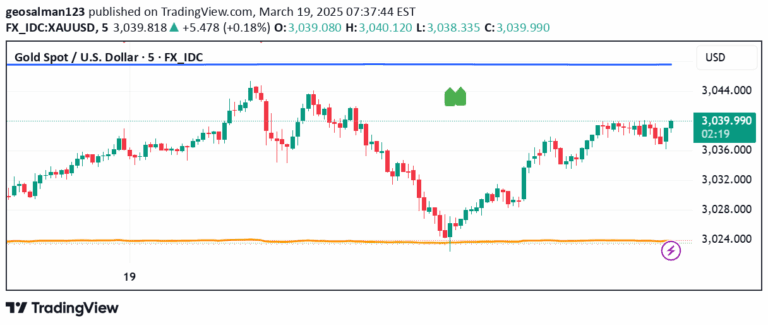
A custom z-score indicator that measures moving average dispersion to identify market trends and consolidation, mapping values between 0-100 for clear trend interpretation.
Explore complementary indicator rolesHow it works
The Adjusted MADI-Z calculates a z-score by analyzing the dispersion of multiple exponentially weighted moving averages across different lengths, including 5, 10, 50, and 200-period averages. It applies a logistic function to transform the raw z-score into a bounded 0-100 scale, which makes trend identification more intuitive and visually interpretable.
By comparing the clustering and spread of these moving averages, the indicator can detect subtle changes in market momentum and trend strength. The transformation process smooths out market noise and provides a standardized measure of trend direction and intensity, allowing traders to quickly assess market conditions.
Why it may be useful
The Adjusted MADI-Z offers traders a sophisticated yet easy-to-understand method of analyzing market trends by converting complex statistical measurements into a simple, actionable scale. Its ability to map trend strength between 0-100 provides immediate visual feedback about market conditions, reducing the cognitive load of interpreting multiple moving average interactions.
By offering clear delineations between strong trends, weak trends, and consolidation periods, this indicator helps traders make more informed decisions about entry and exit points. The flexible design allows customization for different assets and timeframes, making it a versatile tool for various trading strategies.
When to explore it
The Adjusted MADI-Z works best in markets with clear directional movement, such as trending stock indices, forex pairs, and liquid commodity markets. It is particularly effective during periods of sustained momentum, where price demonstrates consistent directional movement above 70 or below 30 on the indicator's scale.
Traders should be cautious during choppy, range-bound markets where the indicator might generate less reliable signals. The tool is most powerful when used in conjunction with other technical analysis methods, such as support and resistance levels, volume confirmation, and additional trend-following indicators.
Keep exploring
What we’ve verified
Access, alerts and repainting behaviour have not been independently verified for this indicator. Check the creator’s current publication and settings.
General descriptions and classifications are recovered research. Verified details above identify the specific checks we have completed. Check the creator’s current publication for later changes.