
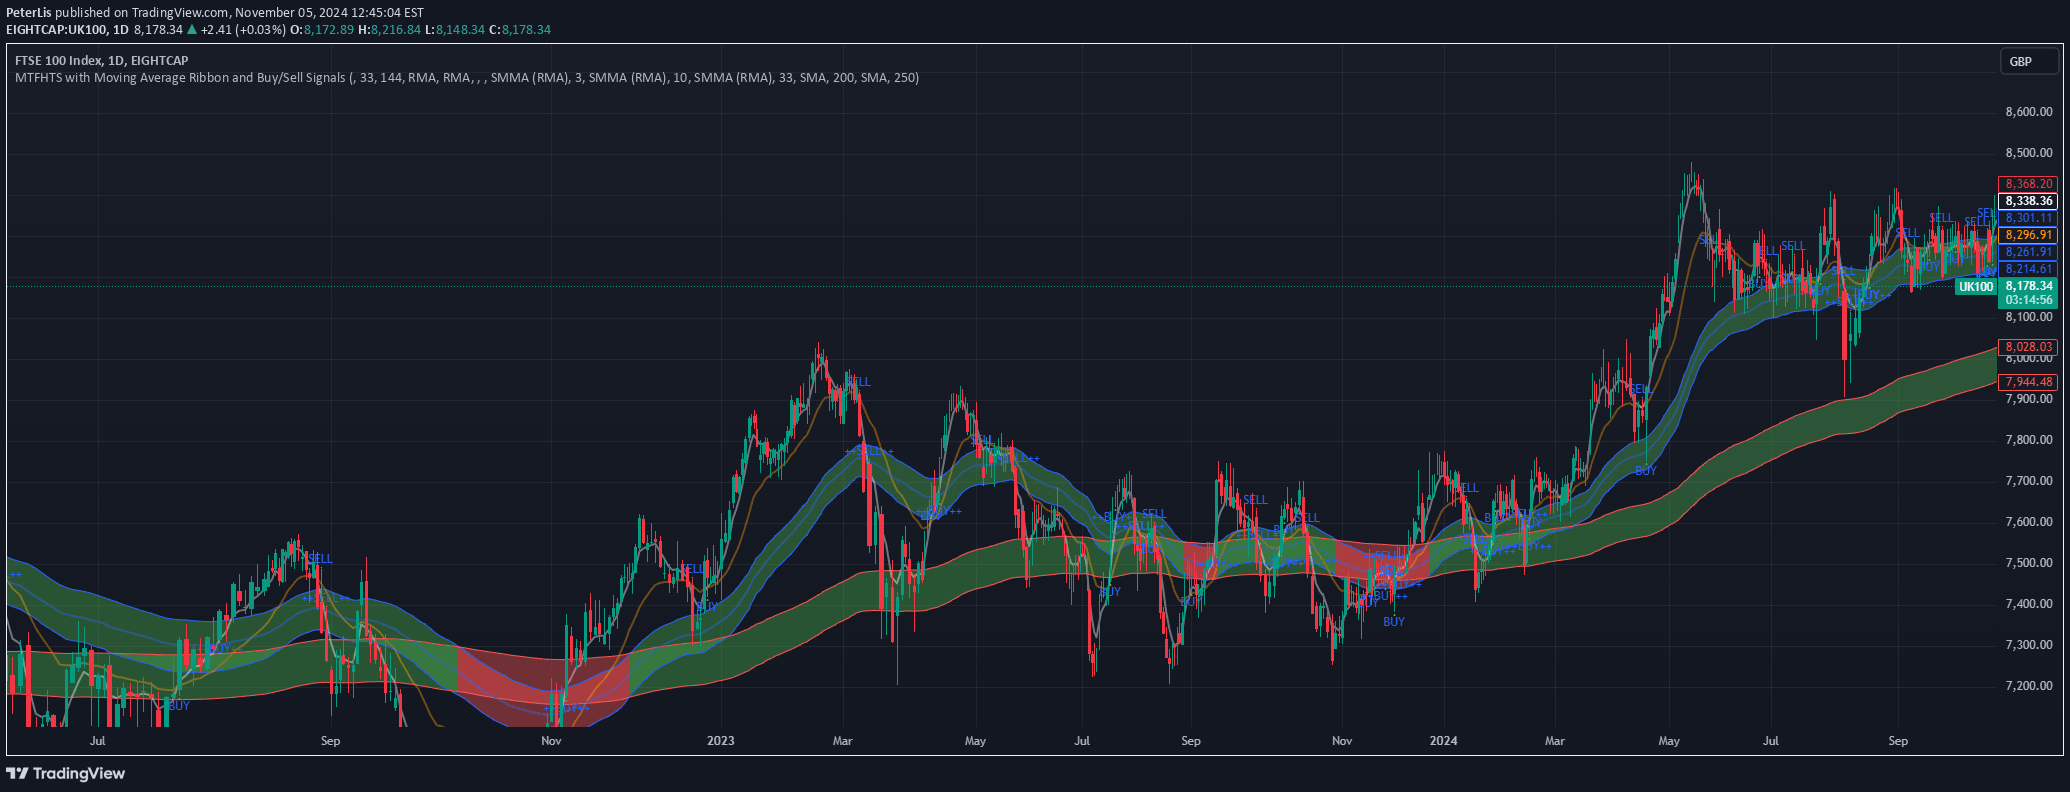
A multi-timeframe moving average strategy that generates buy and sell signals by analyzing crossovers between different moving averages across various timeframes and lengths.
Explore complementary indicator rolesHow it works
The strategy calculates five moving averages using different lengths and types, including SMA, EMA, WMA, and VWMA, to create a comprehensive trend analysis across multiple timeframes. These moving averages are plotted on the chart, allowing traders to visualize trend alignment and market momentum by observing their interactions and crossovers.
When a shorter-term moving average crosses above a longer-term moving average, a buy signal is generated, indicating potential upward momentum. Conversely, when the shorter-term moving average crosses below a longer-term moving average, a sell signal is triggered, suggesting potential downward movement and helping traders identify potential trend reversals.
Why it may be useful
This multi-timeframe moving average strategy provides traders with a systematic approach to analyzing market trends by using multiple moving averages with different characteristics and timeframes. By combining various moving average types and lengths, traders can gain a more comprehensive view of market dynamics and potential trend changes.
The strategy's visual aids, such as color fills between moving averages, help traders quickly assess market conditions and identify bullish or bearish trends. Real-time alerts for buy and sell signals ensure that traders don't miss potential trading opportunities, making the strategy a valuable tool for understanding technical analysis and trend identification.
When to explore it
The multi-timeframe moving average strategy is most effective in markets with clear trending behavior, where price movements show consistent directional momentum across different timeframes. It works particularly well in liquid markets with sufficient trading volume, such as major stock indices, forex pairs, and actively traded commodities.
Traders should consider using this strategy during periods of sustained market trends, avoiding choppy or highly volatile markets where moving average crossovers might generate false signals. It is most reliable when combined with other technical indicators and fundamental analysis to confirm potential entry and exit points.
Keep exploring
What we’ve verified
Access, alerts and repainting behaviour have not been independently verified for this indicator. Check the creator’s current publication and settings.
General descriptions and classifications are recovered research. Verified details above identify the specific checks we have completed. Check the creator’s current publication for later changes.


