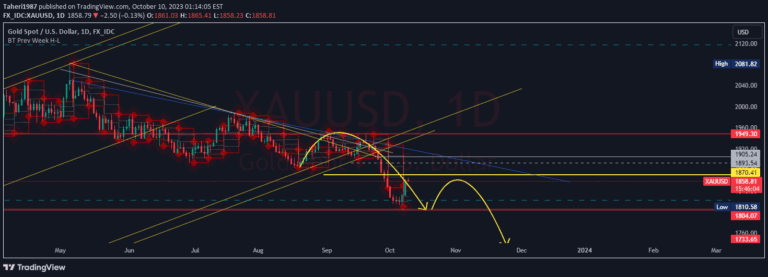
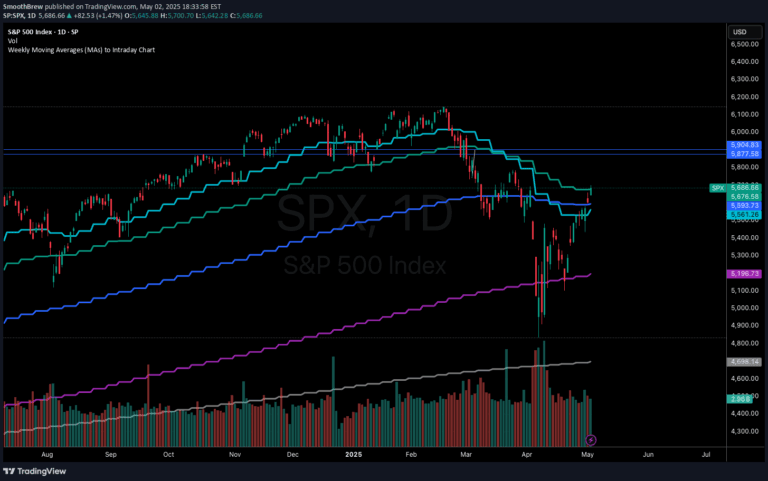
A weekly indicator that calculates the average between high and low prices, offering a central reference point for market analysis and potential trend insights on the weekly chart.
Explore complementary indicator rolesHow it works
The indicator tracks weekly high and low prices through conditional calculations, systematically updating the extreme values for each weekly period. It then computes the midpoint between these weekly highs and lows, creating a central price line that represents the average trading range.
By continuously monitoring and recalculating these values, the script generates a dynamic line that moves across the chart, reflecting the changing weekly price dynamics. This computational approach allows traders to visualize the central tendency of price movements and understand the weekly market balance point.
Why it may be useful
The weekly average line provides traders with a crucial perspective on market equilibrium, helping them understand the balanced point between bullish and bearish price extremes. By representing the midpoint of weekly trading ranges, this indicator offers insights into potential trend strength and market sentiment.
Traders can use this line as a reference for assessing market direction, identifying potential support or resistance levels, and understanding the overall weekly price structure. The simplicity of the average calculation makes it an accessible tool for traders seeking to gain a clearer understanding of market dynamics.
When to explore it
This indicator is most effective when applied to weekly charts, where longer-term trend analysis becomes more meaningful. It works best in markets with clear trending characteristics, helping traders identify potential trend continuation or reversal points based on the weekly price average.
Swing traders and investors focusing on medium to long-term strategies will find this indicator particularly useful. It is especially valuable during periods of consolidation or when trying to assess the overall market direction beyond short-term price fluctuations.
Keep exploring
What we’ve verified
Access, alerts and repainting behaviour have not been independently verified for this indicator. Check the creator’s current publication and settings.
General descriptions and classifications are recovered research. Verified details above identify the specific checks we have completed. Check the creator’s current publication for later changes.