
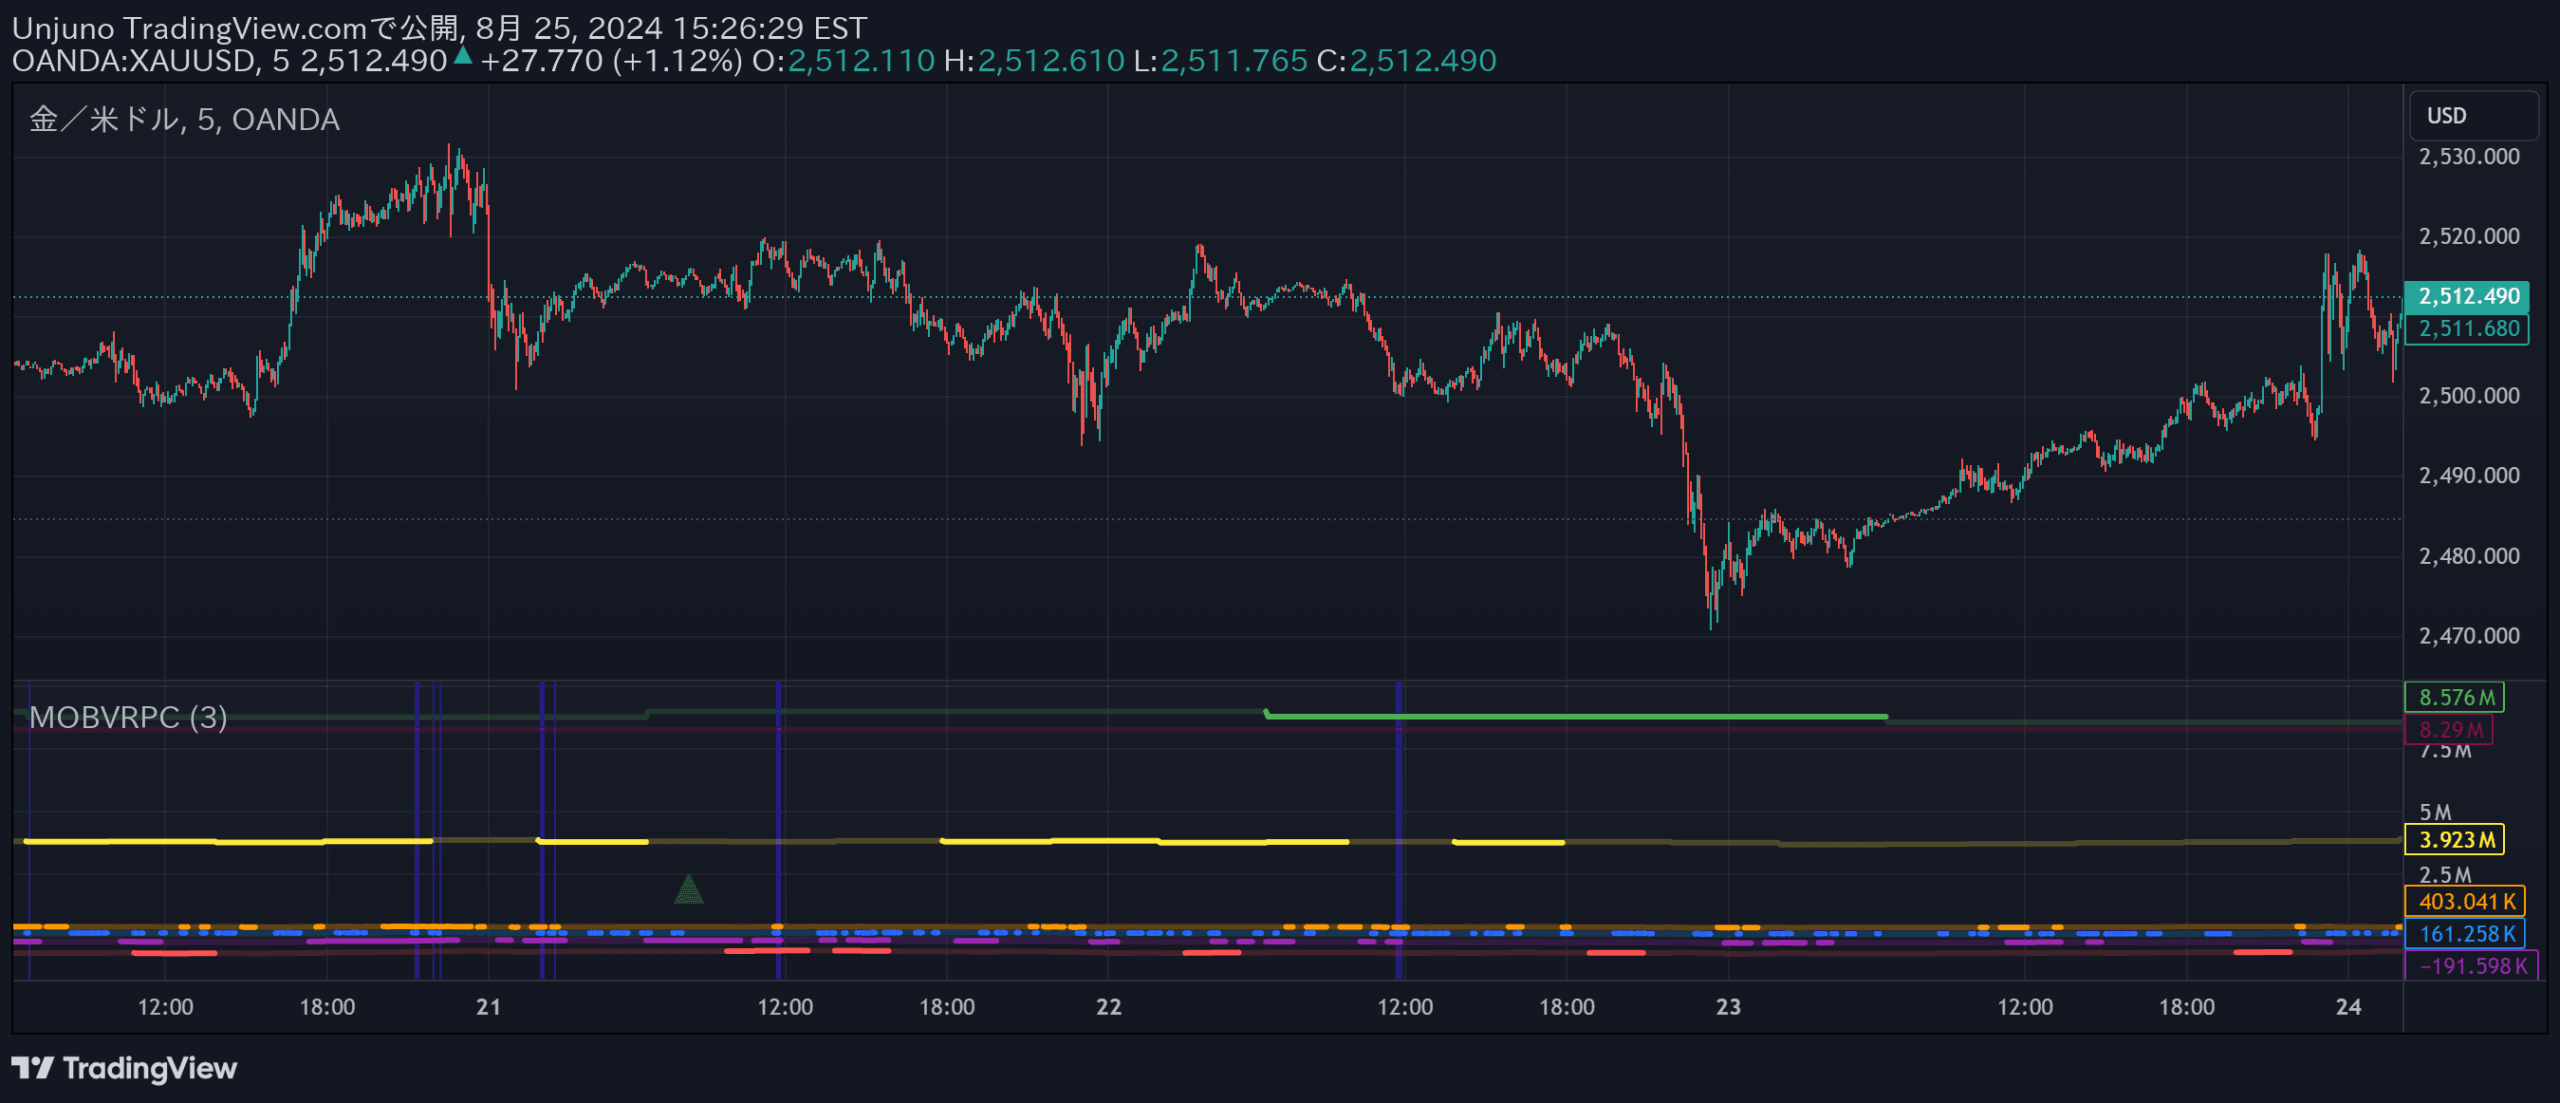
An advanced On Balance Volume (OBV) indicator that tracks volume trends across multiple timeframes and detects specific price patterns to generate trading signals.
Explore complementary indicator rolesHow it works
The OBV indicator calculates volume flow by adding volume on up days and subtracting volume on down days, creating a cumulative line that tracks volume trends. This script enhances traditional OBV by analyzing patterns across multiple timeframes including 5-minute, 15-minute, 30-minute, 1-hour, 4-hour, daily, and weekly charts.
By detecting specific volume patterns like double or triple bottoms, the indicator provides visual signals through background color changes and directional arrows. It systematically checks OBV conditions across different time legs, generating signals when predefined pattern recognition criteria are met across these multiple timeframes.
Why it may be useful
Volume is a critical confirmation tool for price movements, helping traders understand the strength and sustainability of market trends. This OBV indicator offers a comprehensive view of volume dynamics by aggregating volume information across multiple timeframes, providing deeper insights into potential market reversals and trend confirmations.
By integrating pattern recognition with volume analysis, traders can make more informed decisions about entry and exit points. The multi-timeframe approach reduces false signals and increases the probability of identifying genuine trend changes, making it a valuable tool for traders seeking robust, data-driven trading strategies.
When to explore it
This OBV indicator is most effective in markets with significant volume and clear trending characteristics, such as major stock indices, forex pairs, and liquid commodity markets. It works best when traders want to confirm price movements with volume analysis and seek a comprehensive view of market dynamics across different time horizons.
Traders should use this indicator during periods of potential trend reversal or continuation, paying special attention to situations where volume patterns diverge from price action. It is particularly useful for short to medium-term trading strategies that require nuanced understanding of market momentum and volume-driven price movements.
Keep exploring
What we’ve verified
Access, alerts and repainting behaviour have not been independently verified for this indicator. Check the creator’s current publication and settings.
General descriptions and classifications are recovered research. Verified details above identify the specific checks we have completed. Check the creator’s current publication for later changes.


