
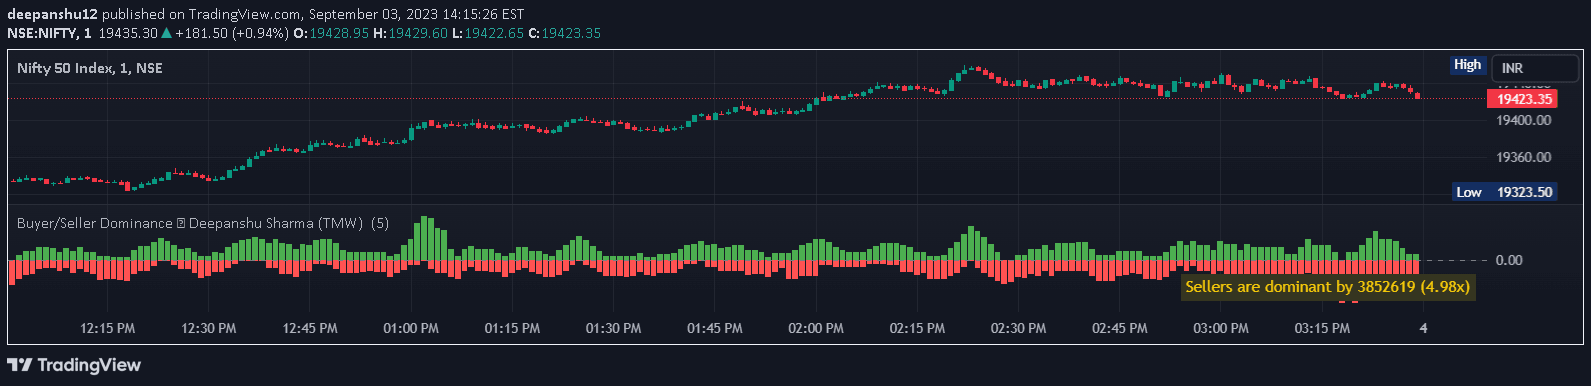
A TradingView indicator that assesses buyer and seller market dominance by analyzing candle volume and price action across specified time segments.
Explore complementary indicator rolesHow it works
The Buyer/Seller Dominance indicator segments historical price data into defined candle intervals, analyzing each segment's market dynamics. It classifies candles as green (bullish) or red (bearish) based on their closing price relative to opening price, tracking the associated trading volume for each type.
By accumulating volumes for green and red candles within each segment, the script generates visual columns representing buyer and seller strength. A central balance line at zero helps traders quickly identify shifts in market sentiment when these dominance columns cross the centerline.
Why it may be useful
This indicator provides traders with a unique perspective on market psychology by quantifying the relative strength of buyers and sellers through volume analysis. It transforms raw price and volume data into an intuitive visual representation that helps traders understand underlying market dynamics and potential trend reversals.
By offering a clear, color-coded visualization of market sentiment, the Buyer/Seller Dominance indicator enables traders to make more informed decisions about potential entry and exit points, and to gauge the conviction behind price movements.
When to explore it
The Buyer/Seller Dominance indicator is most effective in markets with clear directional movements and significant volume fluctuations. It works particularly well in liquid markets like major stock indices, forex pairs, and high-volume cryptocurrency trading environments where volume patterns can provide meaningful insights.
Traders should use this indicator in conjunction with other technical analysis tools to confirm signals and validate potential trading opportunities. It is especially useful during periods of market transition, helping identify moments when buyer or seller momentum might be shifting.
Keep exploring
What we’ve verified
Access, alerts and repainting behaviour have not been independently verified for this indicator. Check the creator’s current publication and settings.
General descriptions and classifications are recovered research. Verified details above identify the specific checks we have completed. Check the creator’s current publication for later changes.


