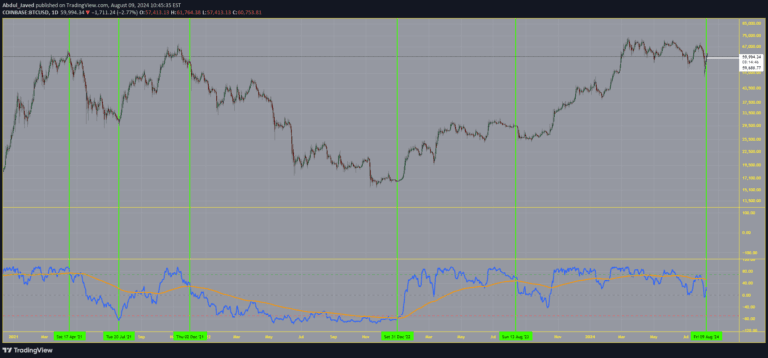
A multi-oscillator trading signal that combines RSI, Stochastic RSI, CCI, and MACD to identify market extremes and momentum shifts directly on the price chart.
Explore complementary indicator rolesHow it works
The Multi Oscillator OB/OS Signals indicator calculates values for four technical oscillators: RSI, Stochastic RSI, CCI, and MACD. Each oscillator is evaluated using custom settings for length periods and price sources to determine specific signal conditions on every price bar.
When predefined conditions are met, such as crossing overbought or oversold levels, the indicator plots distinct visual symbols directly onto the main price chart. For instance, RSI crossing above 70 triggers an overbought symbol, while MACD line crossing its signal line generates bullish or bearish crossover markers.
Why it may be useful
This indicator provides traders with a consolidated view of multiple technical momentum signals, enabling quick visual identification of potential market extremes and trend changes. By combining four different oscillators, it offers a more comprehensive assessment of market conditions than relying on a single indicator.
The multi-oscillator approach helps traders confirm signals, reduce false positives, and gain deeper insights into short-term price momentum. The direct visualization on the price chart allows for immediate recognition of potential trading opportunities without constantly switching between different chart panels.
When to explore it
The Multi Oscillator OB/OS Signals indicator works best in markets with clear trending or ranging characteristics, where momentum and reversal signals are more reliable. It is particularly useful for traders seeking to identify potential trend exhaustion points and short-term momentum shifts across various timeframes.
Traders should employ this indicator in conjunction with other analytical tools, using its signals as part of a comprehensive trading strategy. It is most effective when combined with price action analysis, trend confirmation, and robust risk management techniques to validate potential entry and exit points.
Keep exploring
What we’ve verified
Access, alerts and repainting behaviour have not been independently verified for this indicator. Check the creator’s current publication and settings.
General descriptions and classifications are recovered research. Verified details above identify the specific checks we have completed. Check the creator’s current publication for later changes.