
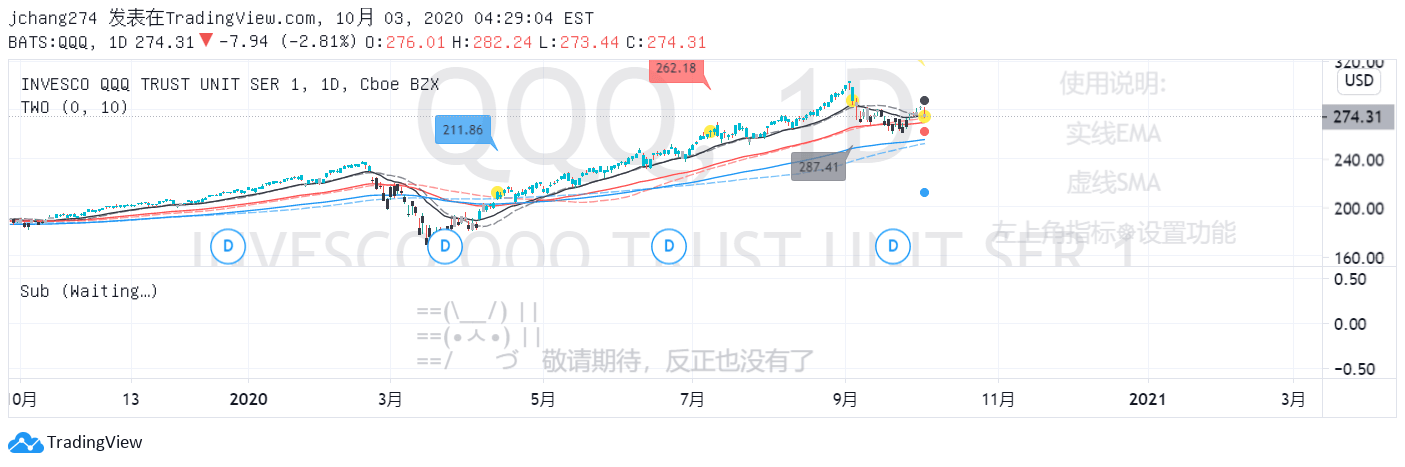
Market breadth is an analytical tool that evaluates the number of stocks advancing or declining in an index, providing insights into overall market strength and potential trend reversals.
Explore complementary indicator rolesHow it works
Market breadth indicators analyze the total number of stocks moving up versus those moving down within a specific index or exchange. They calculate the ratio between advancing and declining stocks to determine market momentum. By tracking how many stocks are participating in a price movement, these indicators reveal underlying market sentiment.
Traders compare the number of stocks above and below their moving averages to assess overall market strength. The analysis helps identify whether a market trend is broad-based or driven by a few large stocks. Complex calculations involve comparing advancing and declining volume and stocks across different market segments
Why it may be useful
Market breadth provides a comprehensive view of market health beyond individual stock performance. It helps traders understand the broader market sentiment and potential trend reversals. These indicators can reveal hidden market weaknesses not apparent from index price charts alone.
By analyzing widespread stock movement, traders gain insights into potential market direction and strength. Market breadth helps identify whether a trend is sustainable or potentially misleading. It offers a more nuanced perspective on market dynamics than simply looking at headline index numbers. Investors use these insights to make more informed trading and investment decisions
When to explore it
Market breadth indicators work best during significant market transitions and trend changes. They are most effective when analyzing broad market indices like S&P 500 or NASDAQ. Traders find these indicators particularly useful during periods of market uncertainty or potential trend reversals. They provide valuable insights during sector rotations and major economic events.
Market breadth is especially helpful when the index appears contradictory to individual stock movements. These indicators are most reliable when used in conjunction with other technical and fundamental analysis tools. Experienced traders often combine market breadth with additional confirmation signals for more robust decision-making
Keep exploring
What we’ve verified
Access, alerts and repainting behaviour have not been independently verified for this indicator. Check the creator’s current publication and settings.
General descriptions and classifications are recovered research. Verified details above identify the specific checks we have completed. Check the creator’s current publication for later changes.


