
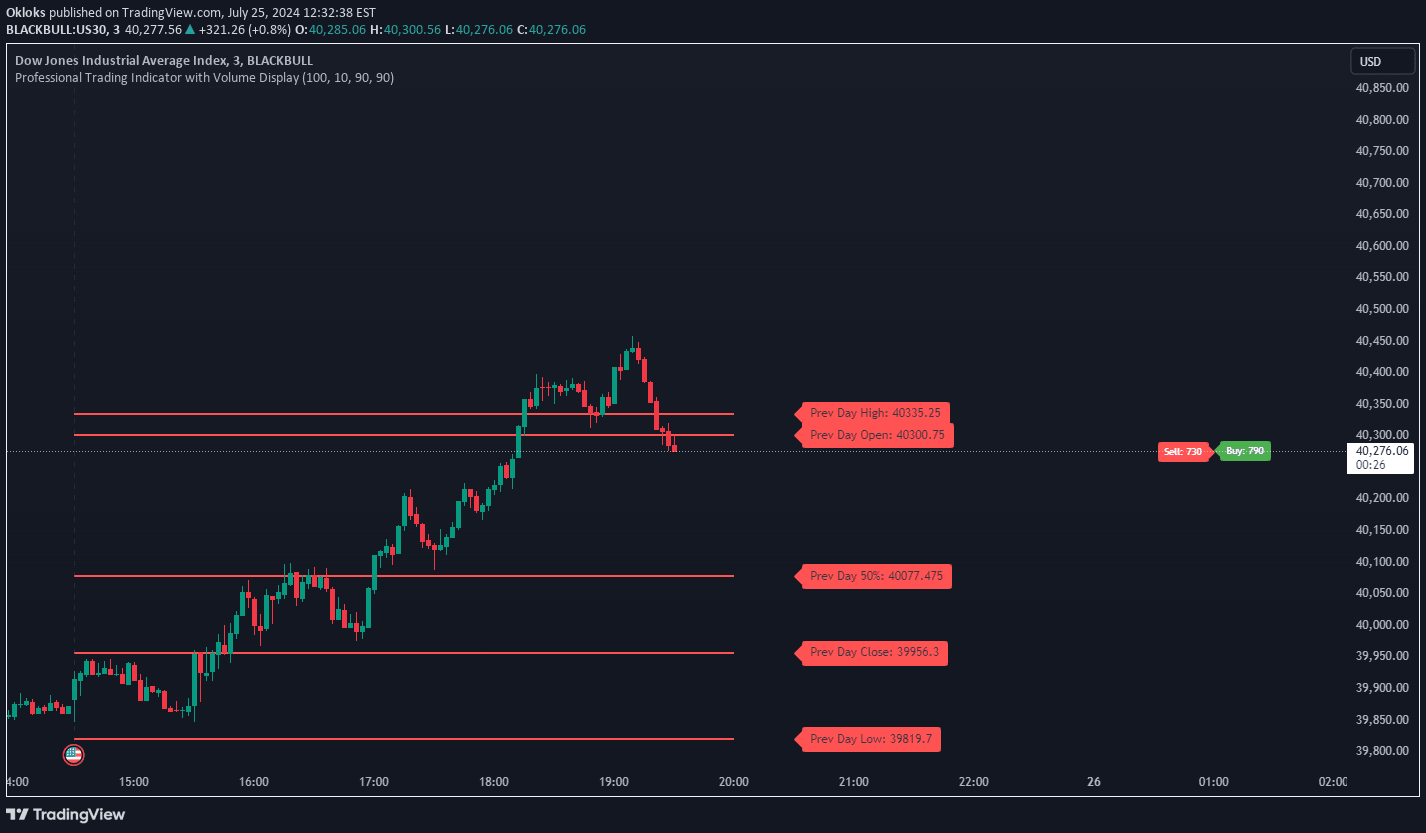
Advanced trading indicator that analyzes volume dynamics and historical price levels across multiple timeframes, providing insights into market sentiment and trading volume behavior.
Explore complementary indicator rolesHow it works
The indicator calculates Cumulative Volume Delta (CVD) by tracking volume changes based on price movement, adding or subtracting volume depending on whether the close price is higher or lower than the open price. It retrieves historical OHLC (Open, High, Low, Close) data from multiple timeframes using advanced security request functions.
The system then plots these historical price levels on the chart, displaying lines and labels for different timeframes like daily, weekly, and monthly. It also computes buying and selling volumes, creating visual representations that help traders understand market dynamics and volume distribution across different price levels.
Why it may be useful
By providing a comprehensive view of volume dynamics and historical price levels, this indicator helps traders make more informed decisions about market sentiment and potential price movements. It bridges the gap between price action and volume analysis, offering insights that are not immediately visible through traditional price charts.
The ability to visualize cumulative volume delta and compare price levels across multiple timeframes gives traders a deeper understanding of market structure. This can help identify potential support and resistance zones, confirm trend strength, and provide context for trading decisions across different market conditions.
When to explore it
This indicator is most effective in markets with significant volume and clear price trends, such as major forex pairs, stock indices, and liquid commodities. Traders can leverage its insights during periods of market transition, when understanding volume dynamics can provide an edge in predicting potential price movements.
It is particularly useful for traders who want to combine multiple analytical perspectives, including volume analysis, price action, and multi-timeframe assessment. The indicator can help confirm entry and exit points, assess market sentiment, and provide a more holistic view of trading opportunities across different timeframes.
Keep exploring
What we’ve verified
Access, alerts and repainting behaviour have not been independently verified for this indicator. Check the creator’s current publication and settings.
General descriptions and classifications are recovered research. Verified details above identify the specific checks we have completed. Check the creator’s current publication for later changes.


