
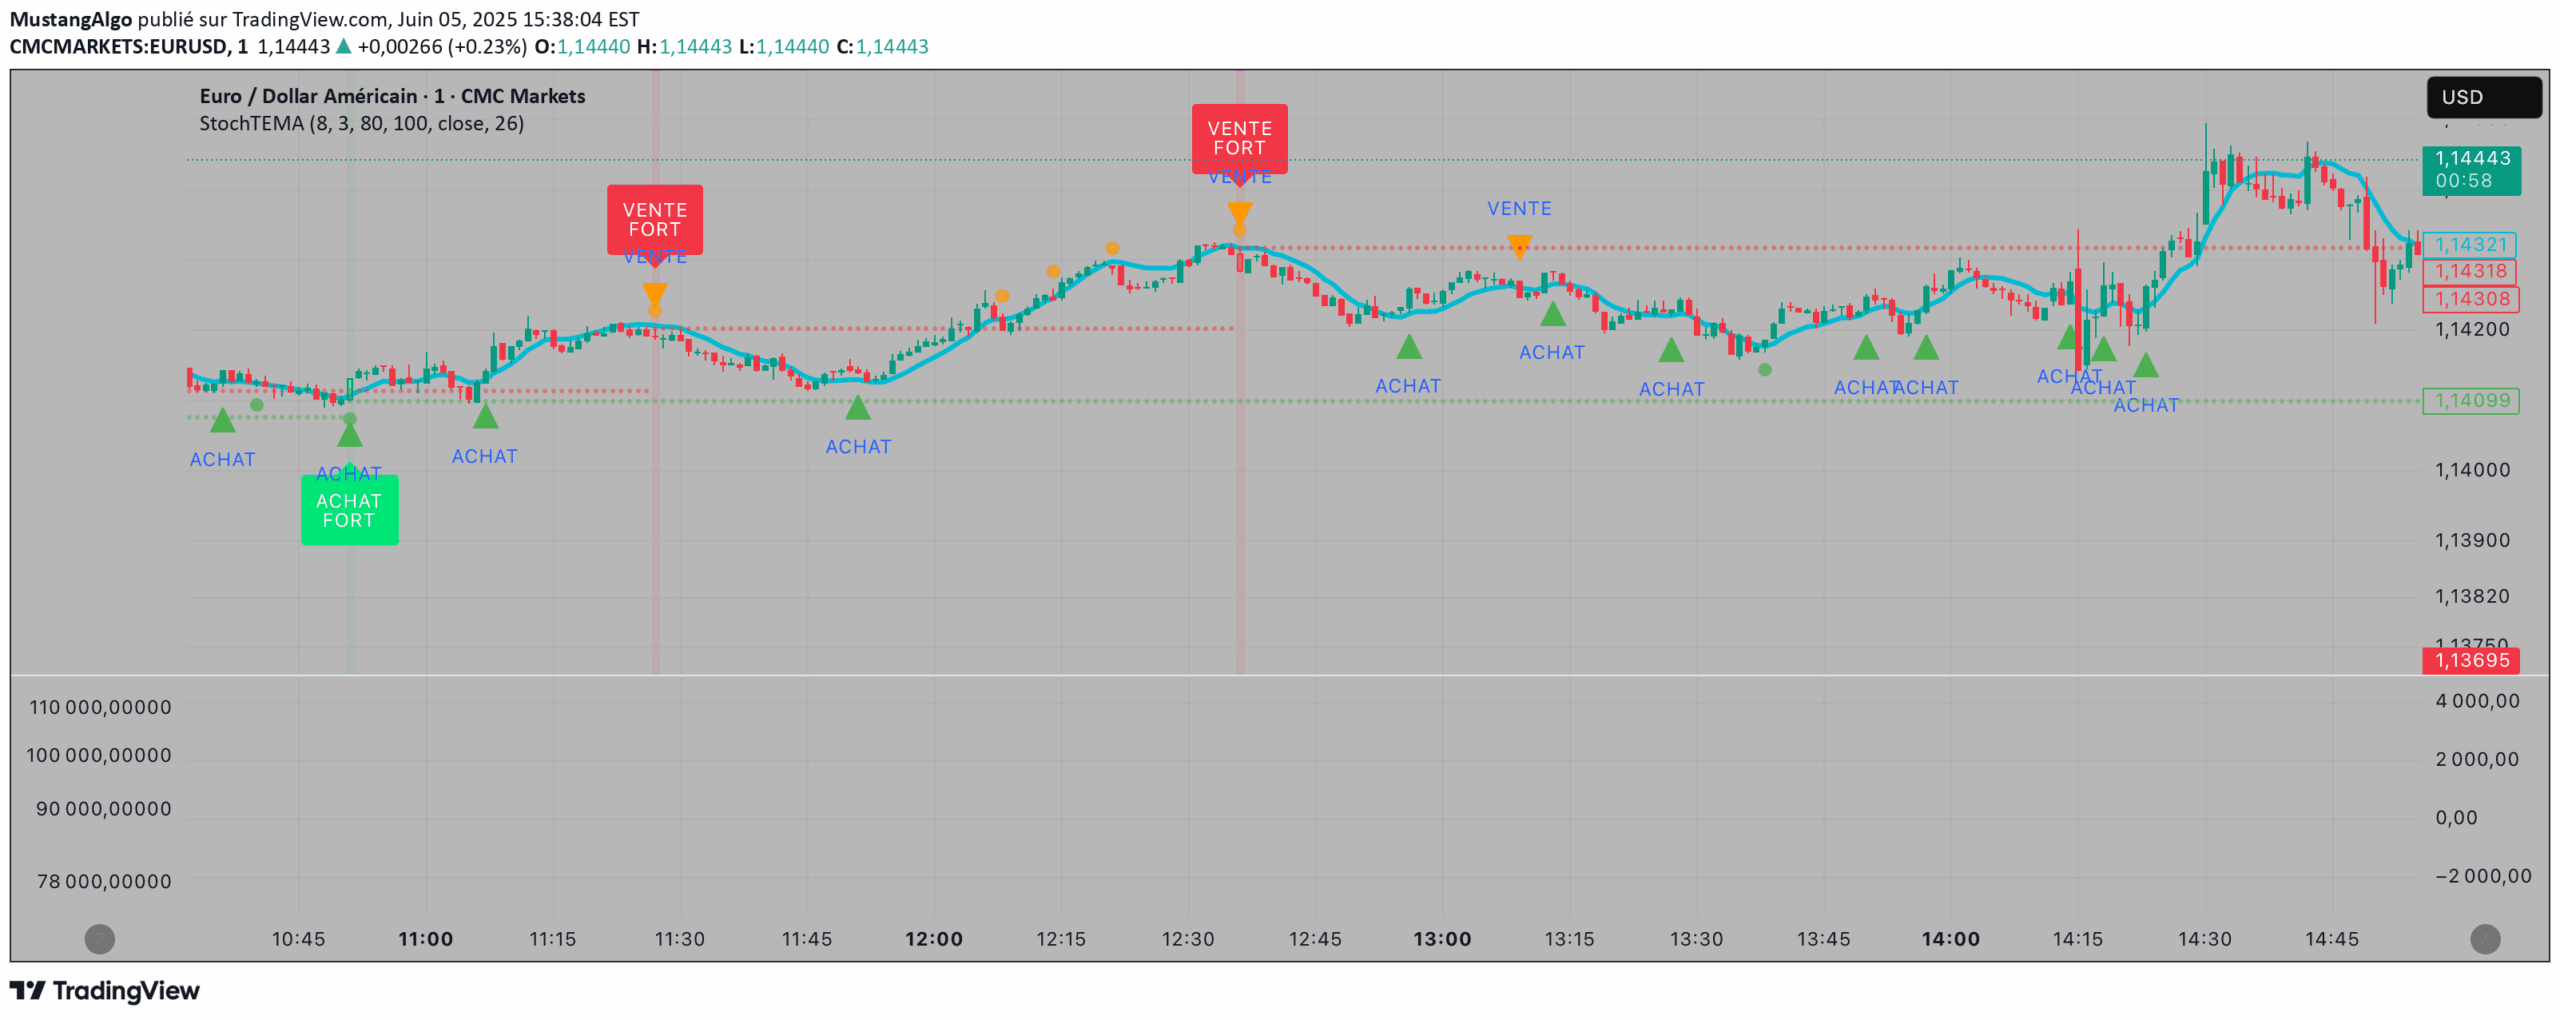
A hybrid trading indicator combining Stochastic RSI and Triple EMA to generate precise buy and sell signals by measuring momentum and trend direction across multiple timeframes.
Explore complementary indicator rolesHow it works
The Stochastic RSI + Triple EMA indicator works by first calculating the Relative Strength Index (RSI) over a specified period and then applying a Stochastic oscillator to those RSI values. This creates a refined momentum indicator that measures the momentum of the RSI itself, providing more nuanced overbought and oversold conditions.
Simultaneously, the Triple Exponential Moving Average (TEMA) calculates three successive exponential moving averages to create a responsive trend line. By combining the Stochastic RSI's momentum signals with the TEMA's trend confirmation, the indicator filters out false signals and provides more reliable entry and exit points across different market conditions.
Why it may be useful
This indicator matters because it addresses two critical trading challenges: identifying momentum and confirming trend direction. By integrating the Stochastic RSI's sensitivity to short-term price movements with the TEMA's trend analysis, traders can make more informed decisions that go beyond simple price action interpretation.
The hybrid approach reduces false signals common in choppy markets, offering traders a more robust tool for timing entries and exits. It provides multiple signal strengths (strong, medium, weak) that allow for flexible trading strategies and risk management across different market environments.
When to explore it
The Stochastic RSI + Triple EMA is most effective in markets with clear trending characteristics, particularly in stocks, forex, and cryptocurrency markets. It performs exceptionally well in timeframes ranging from 5-minute charts for scalping to daily charts for swing trading, making it versatile across different trading styles.
Traders should pay special attention to its signals during market transitions, such as potential trend reversals or breakouts. The indicator is particularly useful when combined with other technical analysis tools, helping to confirm signals and provide additional context for trading decisions.
Keep exploring
What we’ve verified
Access, alerts and repainting behaviour have not been independently verified for this indicator. Check the creator’s current publication and settings.
General descriptions and classifications are recovered research. Verified details above identify the specific checks we have completed. Check the creator’s current publication for later changes.



