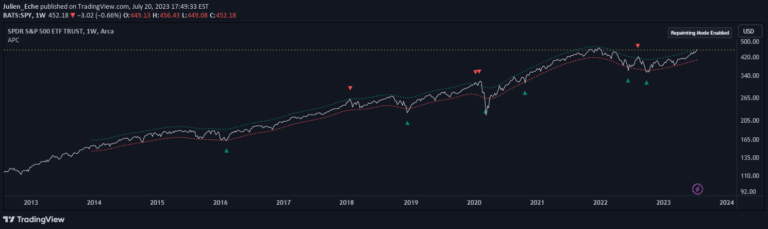
The Nadaraya-Watson Envelope Indicator provides dynamic market insights by analyzing price movements using logarithmic scales and ATR-based envelope boundaries for precise trend identification.
Explore complementary indicator rolesHow it works
The Nadaraya-Watson Envelope Indicator operates by calculating price movements on a logarithmic scale, which allows for more nuanced market analysis. It generates upper and lower bounds using the Average True Range (ATR), creating dynamic support and resistance levels that adapt to current market conditions.
The indicator uses customizable parameters like lookback window and relative weighting to generate an estimation plot. By processing price data through a sophisticated algorithmic approach, it creates visual representations of potential price trajectories, helping traders understand potential market movements with greater precision.
Why it may be useful
The Nadaraya-Watson Envelope Indicator provides traders with a reliable, non-repainting tool that offers deeper insights into market dynamics. Its logarithmic scale captures subtle price nuances that traditional indicators might miss, enabling more accurate trend identification and potential reversal signals.
By offering customizable parameters and clear visual representations, the indicator empowers traders to adapt their analysis to different market conditions and trading styles. The combination of envelope bounds, estimation plots, and flexible configuration makes it a powerful analytical tool for understanding complex price movements.
When to explore it
The Nadaraya-Watson Envelope Indicator is most effective in markets with clear trend characteristics and moderate to high volatility. It performs exceptionally well in timeframes ranging from short-term scalping to longer swing trading scenarios, making it versatile across different trading approaches.
Traders should utilize this indicator when seeking precise trend identification, potential breakout opportunities, and dynamic support/resistance levels. It is particularly useful during periods of market transition, where understanding subtle price movements can provide a significant competitive advantage in decision-making.
Keep exploring
What we’ve verified
Access, alerts and repainting behaviour have not been independently verified for this indicator. Check the creator’s current publication and settings.
General descriptions and classifications are recovered research. Verified details above identify the specific checks we have completed. Check the creator’s current publication for later changes.