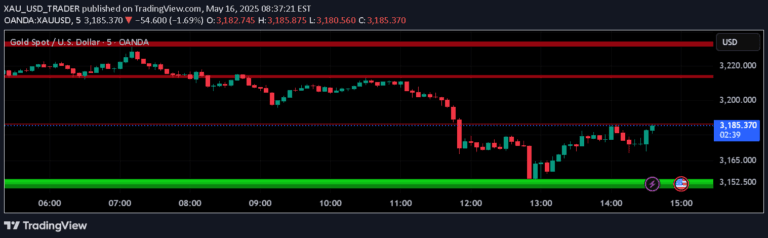
A trading indicator focusing on the opening range breakout strategy using EMA crossovers to generate buy and sell signals for precise market entry and exit points.
Explore complementary indicator rolesHow it works
The indicator begins by identifying and marking the first five-minute trading candle of the day, which establishes the opening range. It calculates Exponential Moving Averages (EMAs) for 5, 20, and 50 periods to track price momentum and trend direction. The script compares the current closing price against the opening range and evaluates the relative positions of different EMAs to generate trading signals.
By tracking daily opening ranges and EMA relationships, the indicator creates buy and sell signals based on specific price action conditions. It dynamically updates data for the last five trading days, allowing traders to visualize historical opening ranges and current market positioning. The signals are plotted as triangles on the chart, providing clear visual indicators of potential trade entry and exit points.
Why it may be useful
This indicator helps traders quickly identify potential trading opportunities by combining multiple technical analysis elements into a single, comprehensive signal generator. By integrating opening range breakout strategy with EMA analysis, it provides a more nuanced approach to market entry and exit than traditional single-metric indicators. The multi-dimensional analysis reduces false signal risks and helps traders make more informed decisions.
The ability to track and visualize opening ranges across multiple days offers traders enhanced market context and trend understanding. The EMA calculations provide momentum insights, while the opening range breakout strategy capitalizes on early market movement patterns. This approach is particularly valuable for traders seeking structured, data-driven trading strategies.
When to explore it
The indicator is most effective in highly liquid markets with clear intraday trends, such as major stock indices, forex pairs, and actively traded commodities. It works best during regular market hours when trading volume is consistent and price movements are more predictable. Traders should use this signal during periods of stable market conditions and avoid using it during extreme volatility or major economic announcements.
Ideal for day traders and scalpers, this indicator provides optimal signals in timeframes ranging from 1-minute to 5-minute charts. It is particularly useful for traders who prefer systematic, rules-based trading approaches and want to leverage both price action and moving average trends. Traders should combine this indicator with other technical and fundamental analysis tools for comprehensive market assessment.
Keep exploring
What we’ve verified
Access, alerts and repainting behaviour have not been independently verified for this indicator. Check the creator’s current publication and settings.
General descriptions and classifications are recovered research. Verified details above identify the specific checks we have completed. Check the creator’s current publication for later changes.