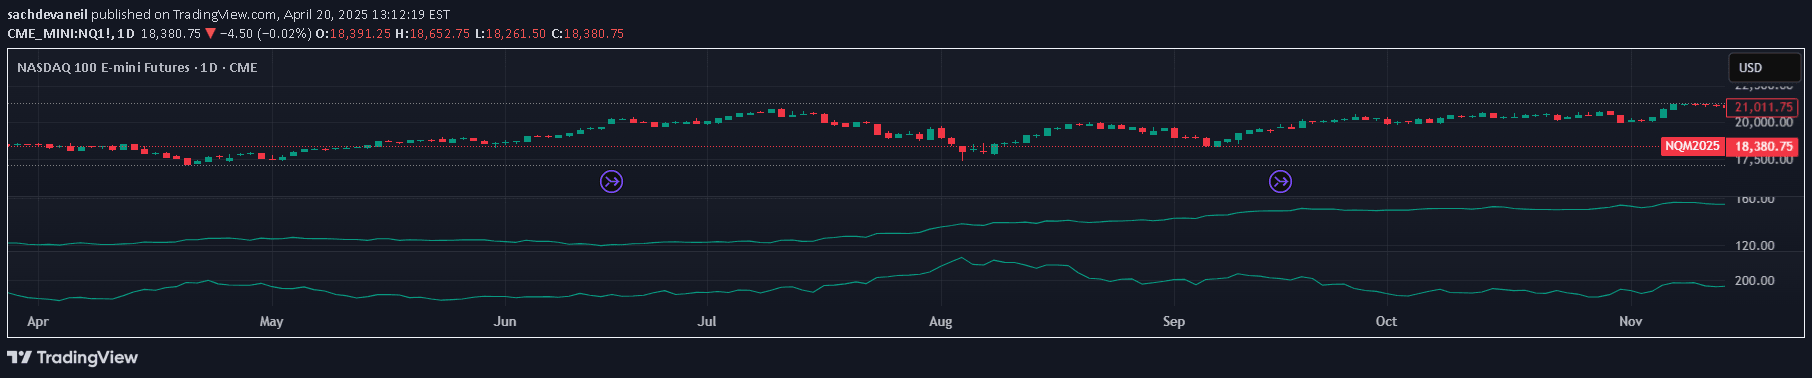
A smoothed Rate of Change indicator using triple pass moving average differencing that captures trend momentum while integrating volume and volatility analysis.
Explore complementary indicator rolesHow it works
The Nasan ROC indicator operates through a sophisticated three-stage filtering process applied to closing prices. It first calculates moving average differences across three distinct filter lengths, creating a cumulative sum of price deviations that effectively detrends the underlying price data.
After generating this cumulative sum, the indicator computes the Rate of Change (ROC) using a specified length, which measures percentage changes in the detrended series. The resulting ROC histogram is color-coded to reflect momentum direction, with green bars indicating increasing momentum and red bars suggesting decreasing momentum.
Why it may be useful
The Nasan ROC provides traders with a nuanced view of market momentum by smoothing out traditional ROC calculations and integrating multiple analytical layers. By combining moving average differencing with cumulative deviation tracking, it offers a more refined perspective on price trends that can help identify potential market shifts.
Moreover, the indicator's incorporation of volume strength and Average True Range (ATR) adds critical context to momentum signals, allowing traders to assess not just price movement, but the underlying market conditions that support those movements.
When to explore it
The Nasan ROC indicator is most effective in markets with clear directional trends and significant volume activity. Traders should prioritize using this indicator during periods of substantial price movement, where volume and volatility provide meaningful confirmation of momentum signals.
It is particularly valuable in short to medium-term trading scenarios, especially when combined with other technical analysis tools. The indicator's color-coded histogram and background gradient offer visual cues about market strength, making it especially useful for traders seeking to understand both trend direction and market energy.
Keep exploring
What we’ve verified
Access, alerts and repainting behaviour have not been independently verified for this indicator. Check the creator’s current publication and settings.
General descriptions and classifications are recovered research. Verified details above identify the specific checks we have completed. Check the creator’s current publication for later changes.