
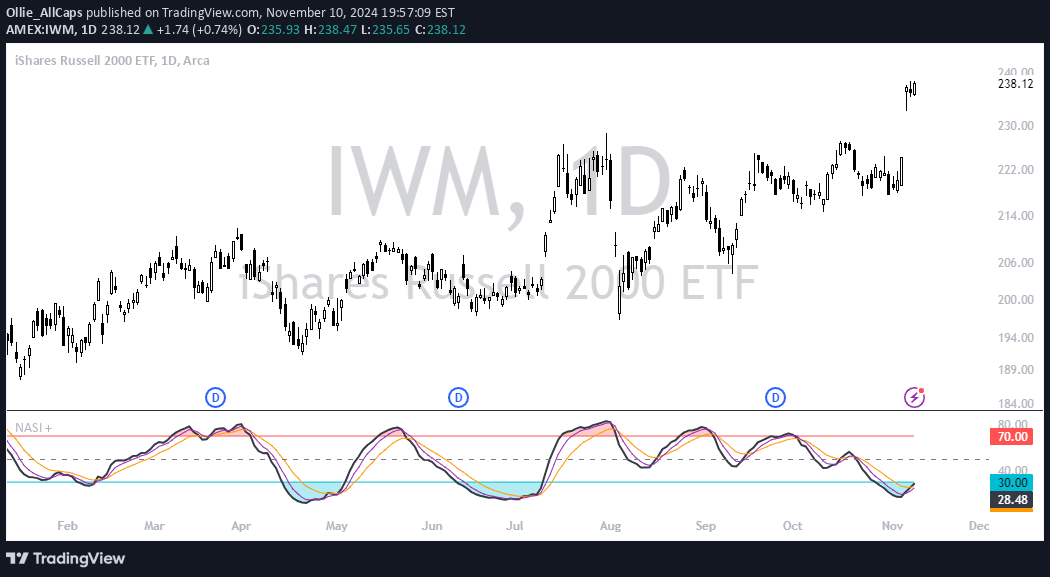
NASI+ is an advanced market breadth indicator combining McClellan Oscillator with RSI to provide deeper insights into market momentum and trend shifts.
Explore complementary indicator rolesHow it works
The NASI+ indicator begins by calculating the McClellan Oscillator, which measures the difference between 19-day and 39-day exponential moving averages (EMAs) of net advancing issues. This provides a baseline assessment of market breadth, tracking the overall market momentum by comparing the number of advancing stocks to declining stocks.
The indicator then applies the Relative Strength Index (RSI) to the cumulative McClellan Oscillator values, adding an additional layer of momentum analysis. Two extra EMAs - a 10-day and a 4-day - are applied to the RSI, creating a more refined signal that helps identify potential overbought and oversold conditions with greater precision.
Why it may be useful
The NASI+ provides traders with a sophisticated tool for understanding market dynamics beyond simple price action. By combining multiple analytical techniques, it offers a comprehensive view of market momentum that can help traders make more informed decisions about potential trend shifts and market sentiment.
Unlike single-dimensional indicators, NASI+ integrates breadth analysis, momentum assessment, and multiple moving averages to create a more nuanced market perspective. This multi-layered approach allows traders to gain deeper insights into market conditions, potentially identifying opportunities that might be missed by more traditional technical analysis methods.
When to explore it
The NASI+ is most effective during periods of significant market movement, particularly when trying to assess the underlying strength of a trend. It works particularly well in markets with clear directional movements, helping traders identify potential trend reversals or confirmations of existing market directions.
Traders should pay special attention to the indicator during times of market uncertainty, such as during economic announcements, earnings seasons, or periods of increased market volatility. The combination of breadth analysis and momentum indicators makes NASI+ particularly valuable for traders seeking to understand the broader market context beyond individual stock movements.
Keep exploring
What we’ve verified
Access, alerts and repainting behaviour have not been independently verified for this indicator. Check the creator’s current publication and settings.
General descriptions and classifications are recovered research. Verified details above identify the specific checks we have completed. Check the creator’s current publication for later changes.


