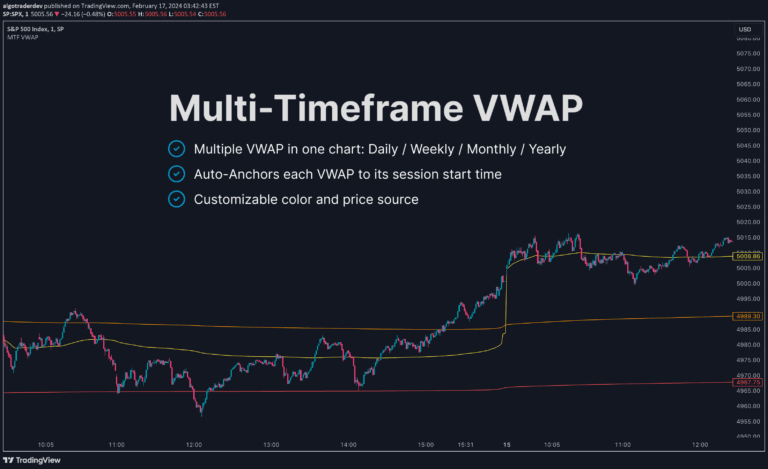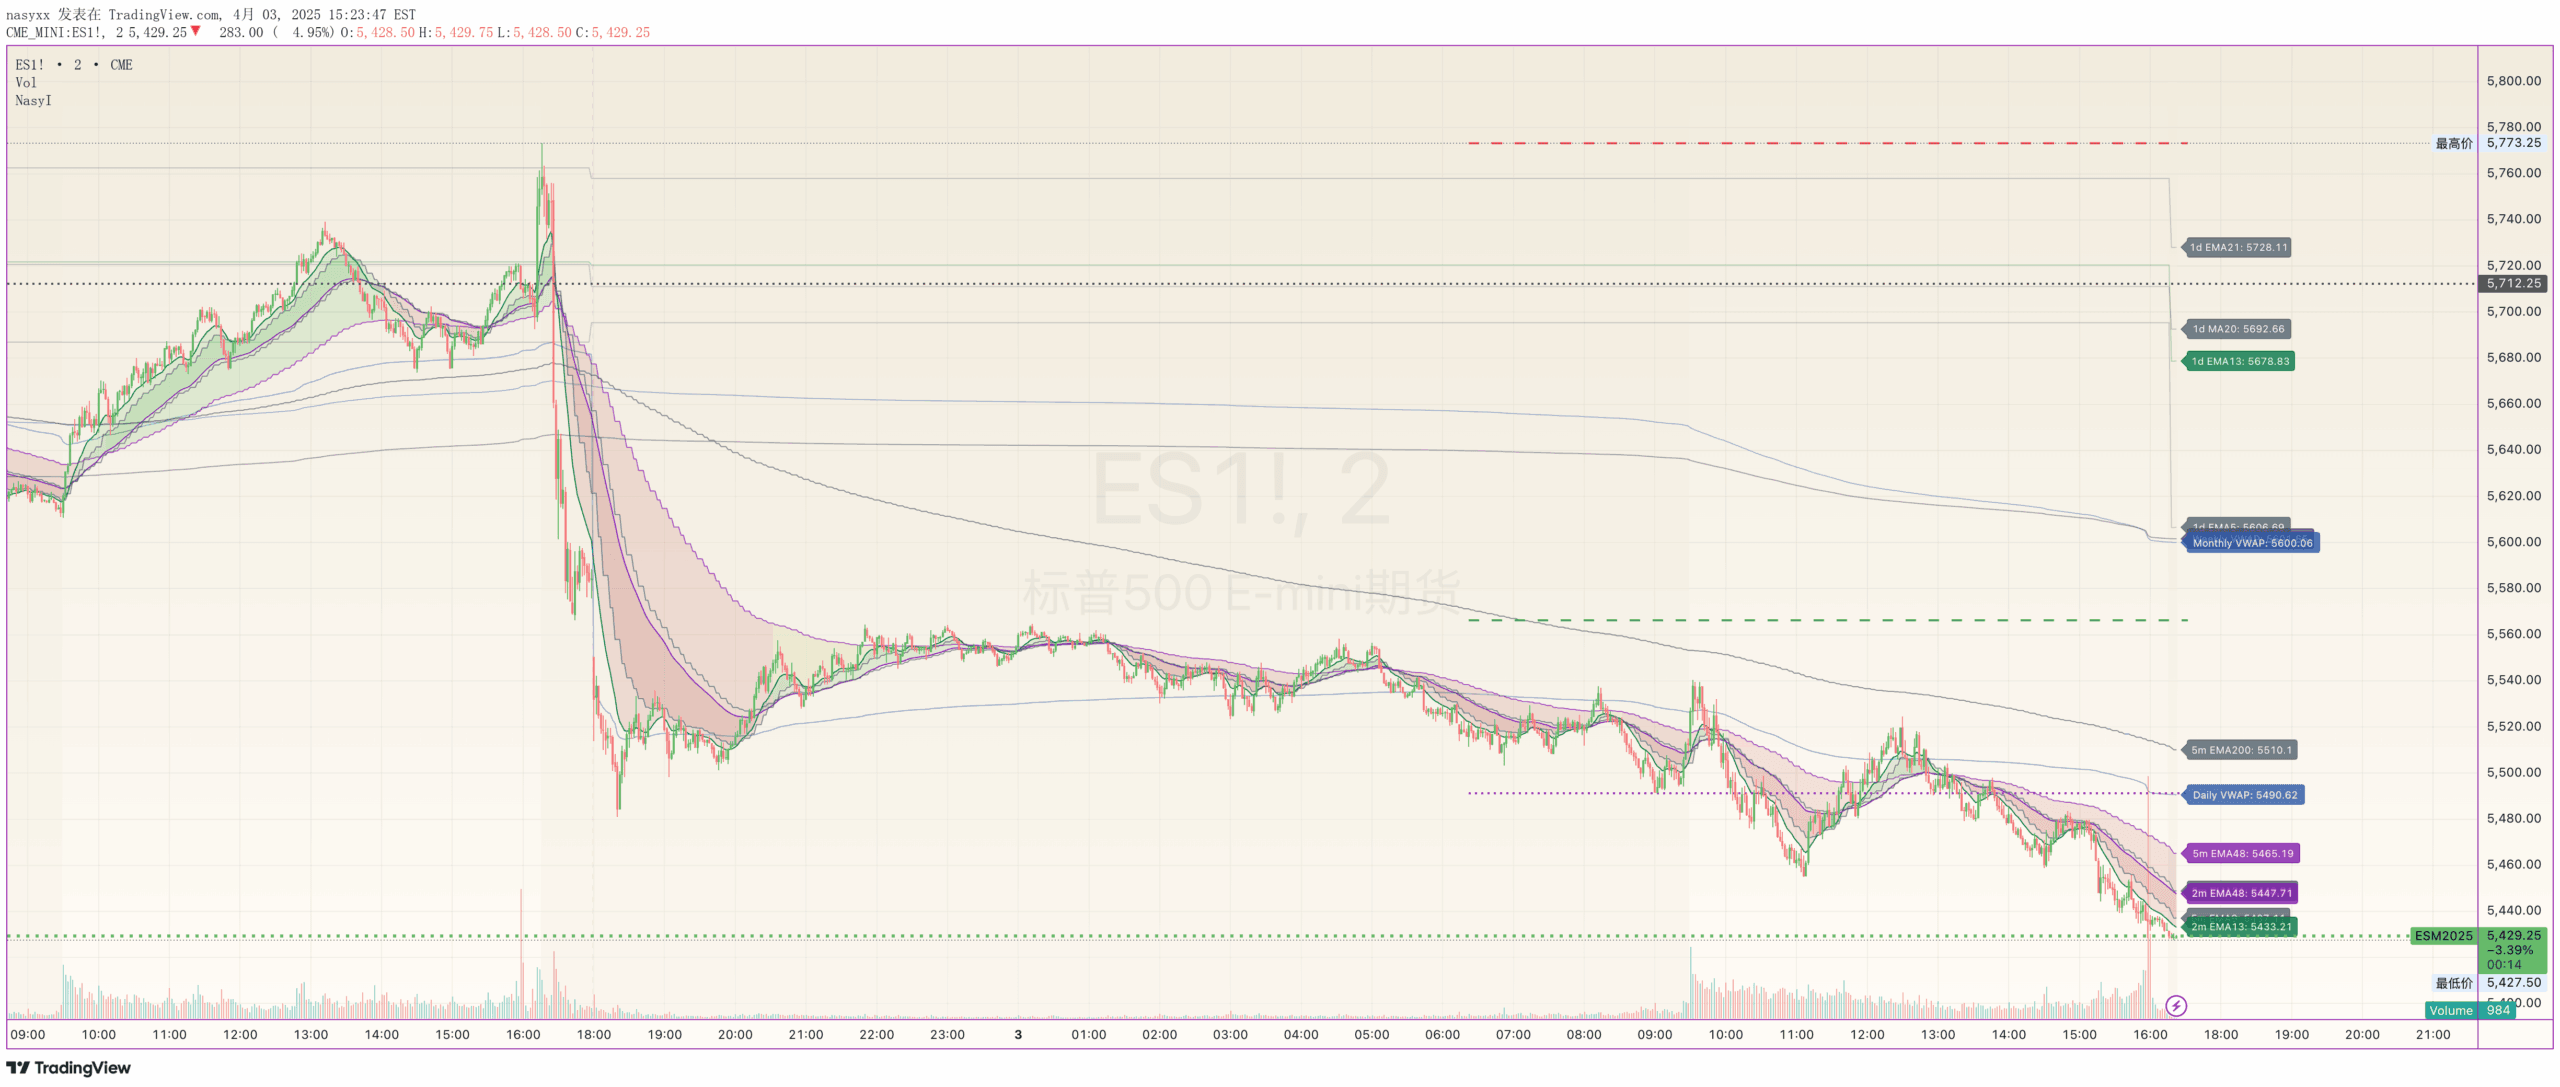
NasyI is a comprehensive multi-timeframe technical analysis toolkit that combines EMAs, VWAPs, and support/resistance levels to provide a holistic view of market dynamics across different time periods.
Explore complementary indicator rolesHow it works
NasyI operates by integrating multiple exponential moving averages (EMAs) across 2-minute, 5-minute, and daily timeframes. It creates color-coded bands between EMAs to visually represent trend strength and direction. The indicator simultaneously tracks Volume Weighted Average Price (VWAP) at daily, weekly, and monthly levels.
It identifies key support and resistance levels by marking previous day's high/low points and pre-market price zones. The system color-codes trends green for bullish, red for bearish, and yellow for neutral market conditions
Why it may be useful
This indicator provides traders with a comprehensive market analysis tool that eliminates the need for multiple separate indicators. By consolidating trend information, institutional price levels, and support/resistance zones into a single display, it helps traders make more informed decisions.
The visual color-coding makes trend identification intuitive, while the multi-timeframe approach ensures traders can understand both short-term and long-term market dynamics simultaneously
When to explore it
NasyI is most effective during active trading sessions, particularly for intraday timeframes between 1-30 minutes. It works best in liquid markets with clear price movements, such as major stock indices, forex pairs, and actively traded stocks.
Traders can leverage this indicator during periods of market volatility, when trend confirmation and institutional price levels become critical. It is particularly useful for day traders, scalpers, and swing traders seeking a comprehensive market analysis tool
Keep exploring
What we’ve verified
Access, alerts and repainting behaviour have not been independently verified for this indicator. Check the creator’s current publication and settings.
General descriptions and classifications are recovered research. Verified details above identify the specific checks we have completed. Check the creator’s current publication for later changes.