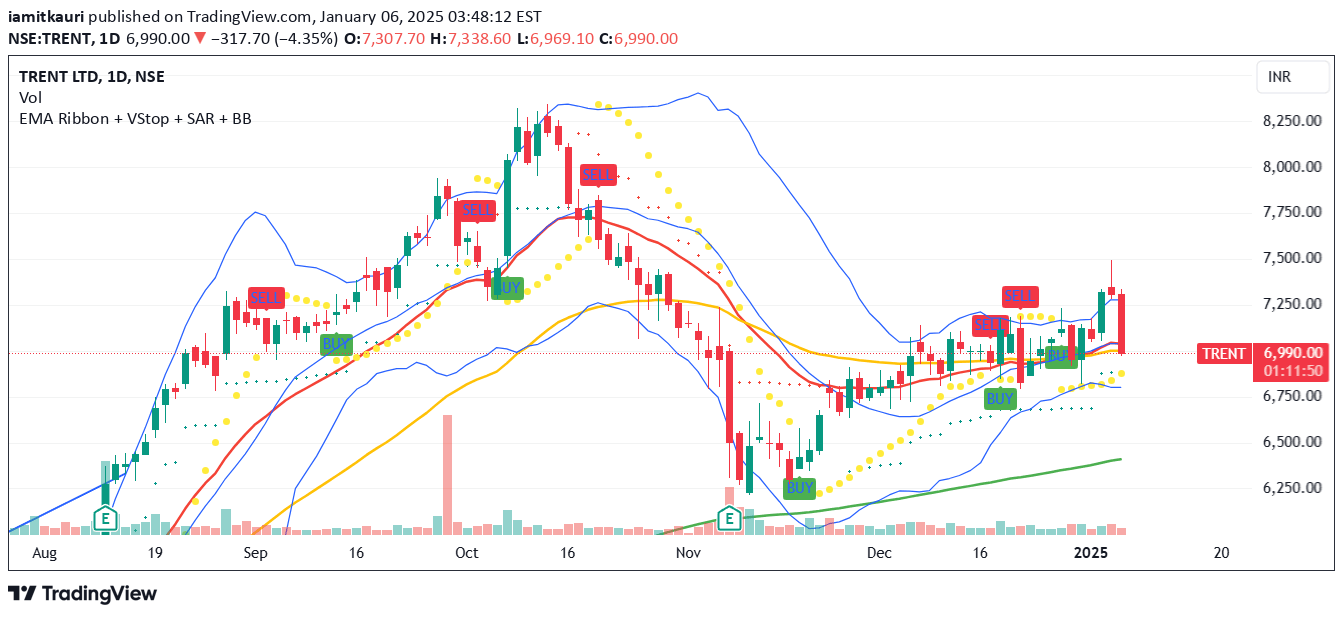
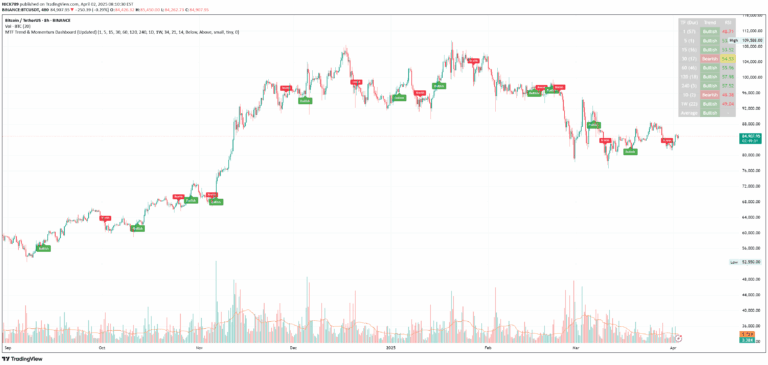
The Nebula SAR Echo is an advanced technical indicator using Parabolic SAR with dynamic color gradients to identify market trends and potential reversals with enhanced visual clarity.
Explore complementary indicator rolesHow it works
The Nebula SAR Echo operates by implementing an advanced Parabolic Stop and Reverse (SAR) calculation method with dynamically adjustable coefficients. It tracks price movements and generates visual markers that indicate potential trend reversals by plotting points above or below price candles.
The indicator utilizes gradient color coding to provide immediate visual feedback about trend strength and direction. Green shades represent bullish trends while red shades indicate bearish trends, with color intensity correlating to the trend's momentum and reliability of the signal.
Why it may be useful
The Nebula SAR Echo provides traders with a sophisticated tool for understanding market dynamics by combining mathematical trend detection with intuitive visual representation. Its advanced calculation method offers more responsive and accurate trend identification compared to traditional indicator approaches.
By integrating color-based gradient visualization, the indicator allows traders to quickly interpret complex market conditions without extensive technical analysis. This approach simplifies decision-making processes and helps traders recognize potential entry and exit points more efficiently.
When to explore it
The Nebula SAR Echo is most effective in markets with clear directional movements, such as trending stocks, forex pairs, and cryptocurrency markets. It performs exceptionally well in environments where price exhibits consistent momentum and predictable directional shifts.
Traders should utilize this indicator across multiple timeframes, from short-term scalping to longer-term swing trading strategies. Its versatility makes it particularly valuable during periods of market transition, helping traders identify potential trend reversals and maintain adaptive trading approaches.
Keep exploring
What we’ve verified
Access, alerts and repainting behaviour have not been independently verified for this indicator. Check the creator’s current publication and settings.
General descriptions and classifications are recovered research. Verified details above identify the specific checks we have completed. Check the creator’s current publication for later changes.